Global SmallCap – Have Investors Capitulated?
Executive Summary
In May 2023, we wrote that “the conditions for SmallCap to start outperforming – and possibly in a spectacular manner – are rapidly falling into place”. Five months on, we are still patiently waiting for this recovery in SmallCap to take hold. In the meantime, SmallCap has continued to underperform, valuations have reached new depths and sentiment remains firmly against the asset class. The rapid increase in bond yields since the summer is partly to blame for this.
Many signs point to a period of investor capitulation that is already well under way. However, in recent weeks SmallCap appears to have resurfaced on some institutional investors’ radar – a sign, perhaps, that the end is in sight. If our assessment of the situation is correct, then the remaining pain could be short-lived and pave the way for a strong recovery.
In this report, our aim is not to revisit the points made in our note published in May (available here) – they all remain valid – but to provide an update on SmallCap returns, flows and valuations, mainly in the form of charts and tables.
In summary:
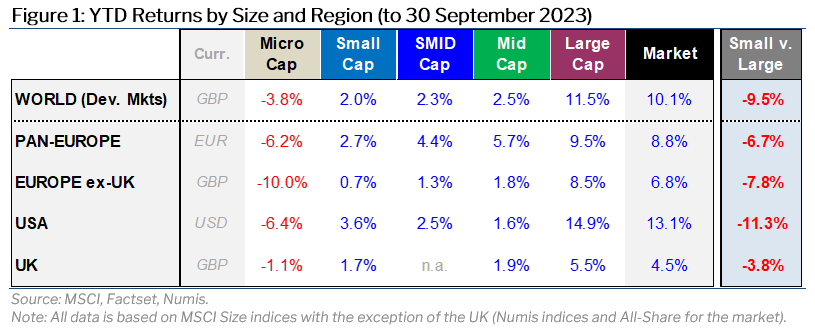
- YTD returns across most Developed Markets have been positively correlated with size (Figure 1) – SmallCap has underperformed LargeCap in every region, notably in the US where the YTD underperformance is now in excess of 11% (the reasons for this are well known so we will not discuss them here). MicroCap has been a significant underperformer everywhere.
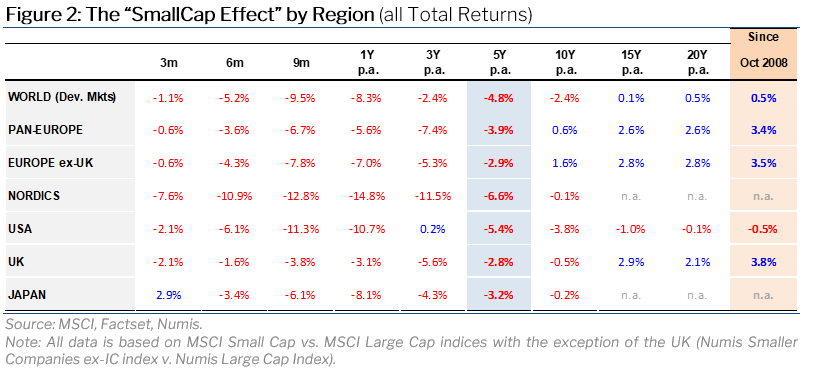
- SmallCap has been lagging LargeCap everywhere for more than 5 years now (Figure 2) – This comes in contrast with a strong track record of long-term outperformance (the so-called “SmallCap Effect” or “Size Effect”).
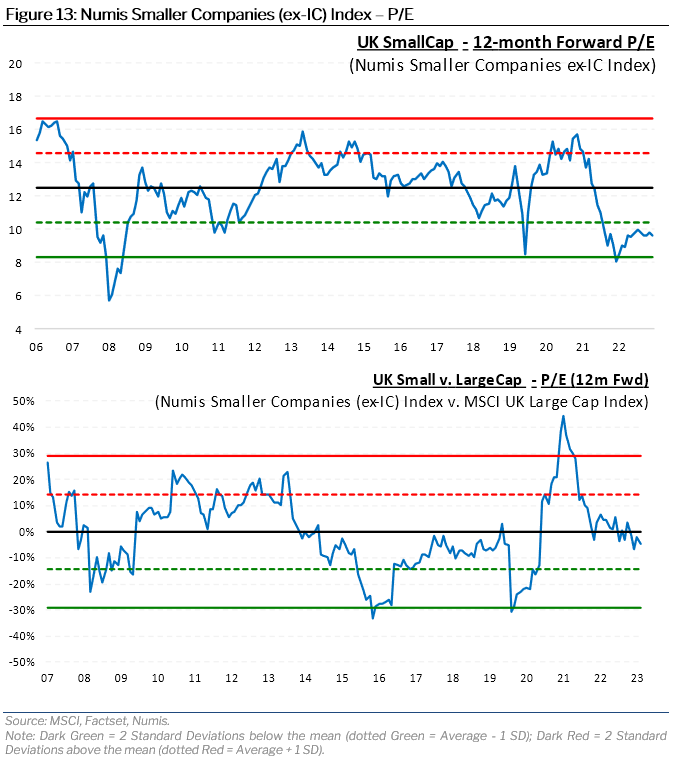
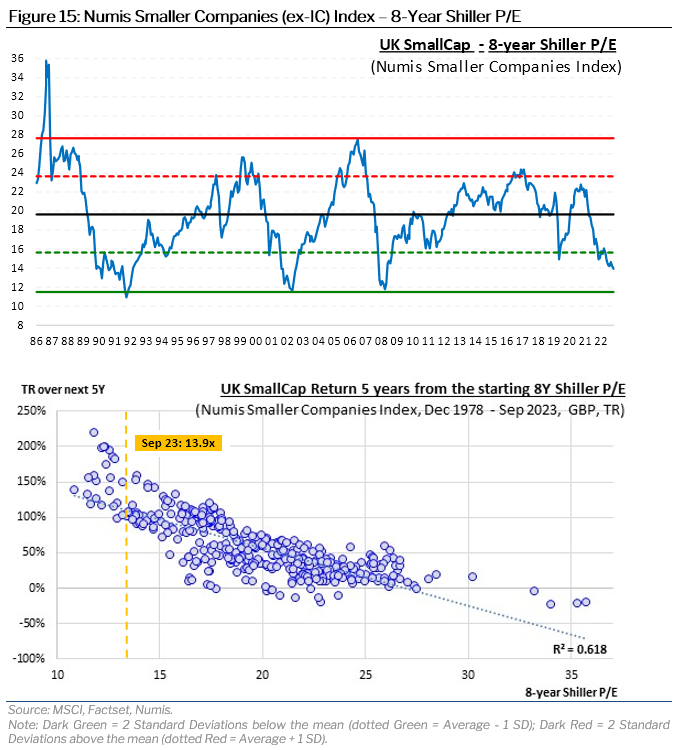
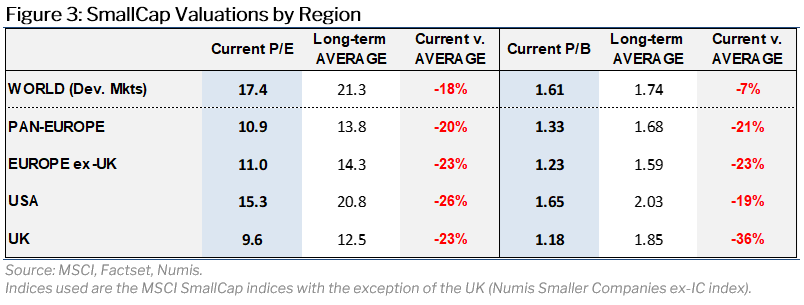
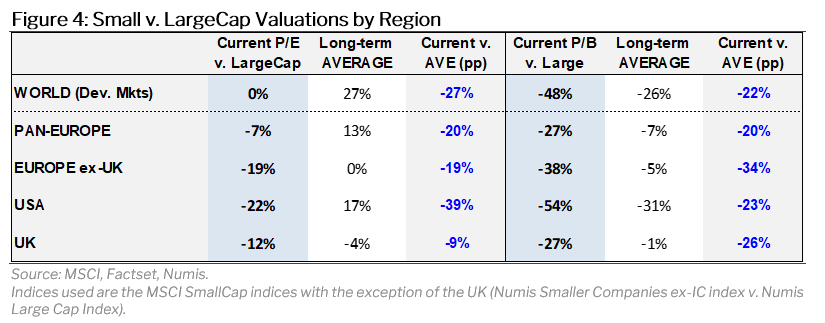
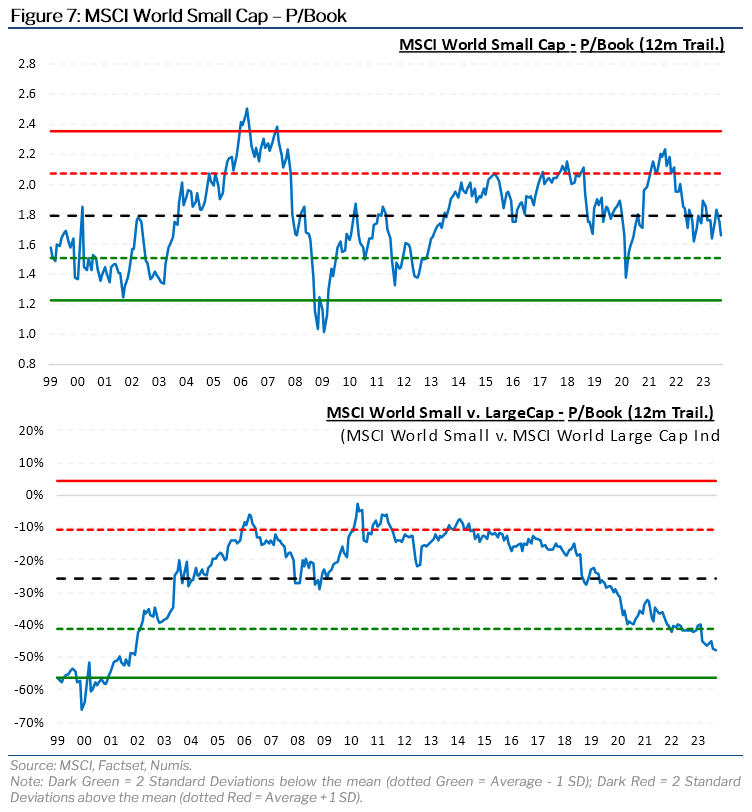
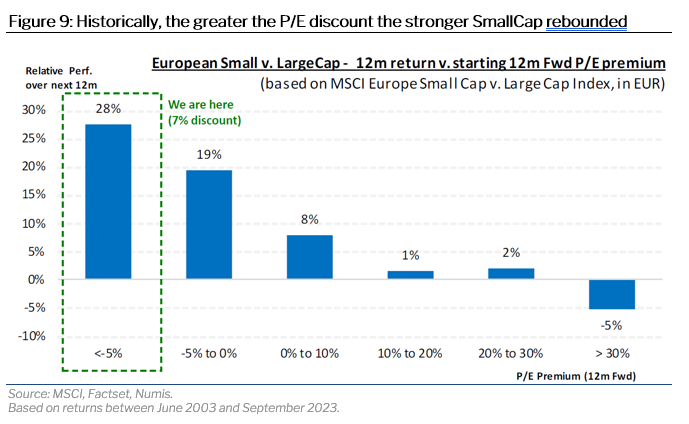
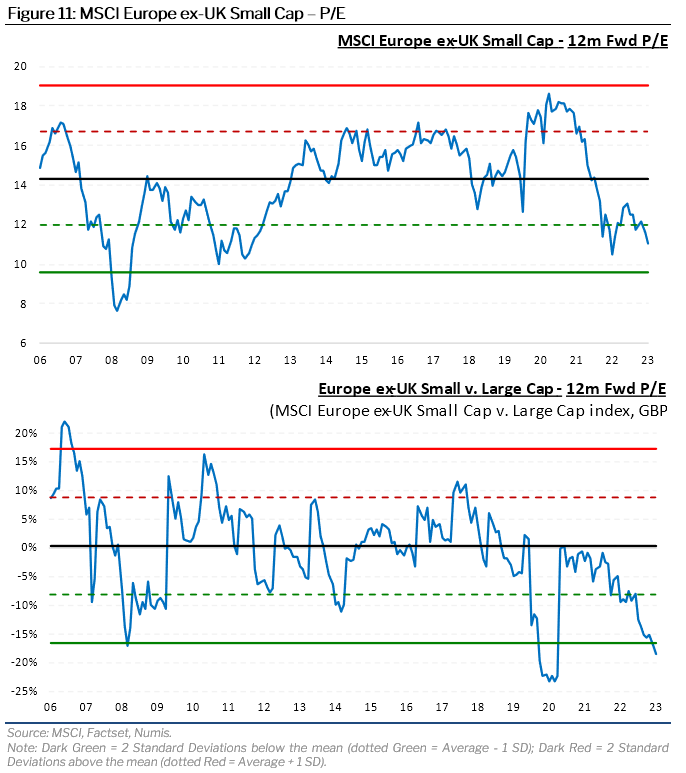
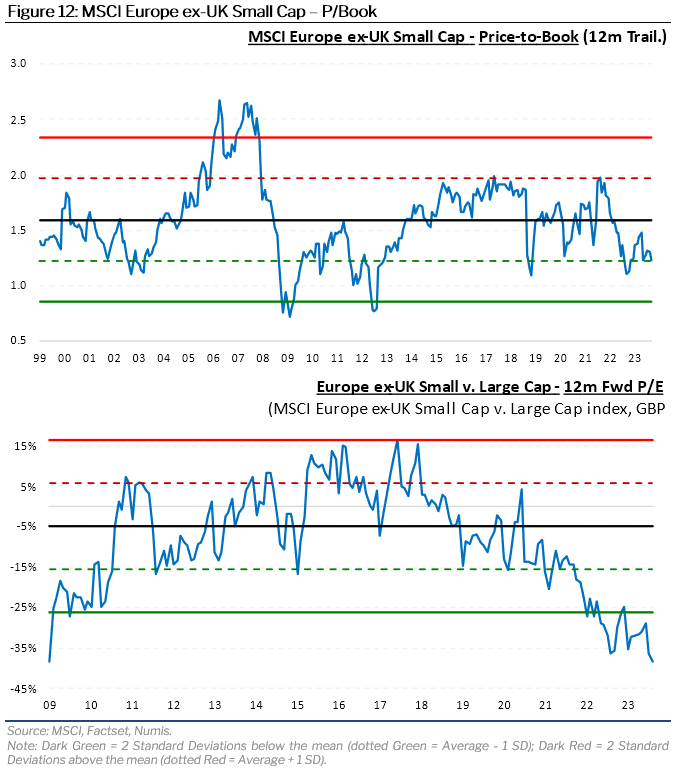
- SmallCap valuations are reaching oversold levels (Figures 3 and 4) – Across all regions, SmallCap is trading well below its long-term average, both on P/E and P/Book. In some markets (Europe in particular) the asset class is close to all time lows relative to LargeCap. The MSCI Europe Small Cap index, for instance, is trading on a 7% discount to LargeCap, which is almost on par with the levels reached at the depths of the COVID Bear Market (-8%) and the Great Financial Crisis (-10%). As we show in Figure 9, every time such levels were reached in the past 20 years, SmallCap made a strong recovery v. LargeCap in the following 12 months. As illustrated by Figure 15, at 13.9x the 8-year Shiller P/E for UK SmallCap is currently on levels last seen in early 2009. The Shiller P/E has only been lower than today 6% of the time since 1986 (!).
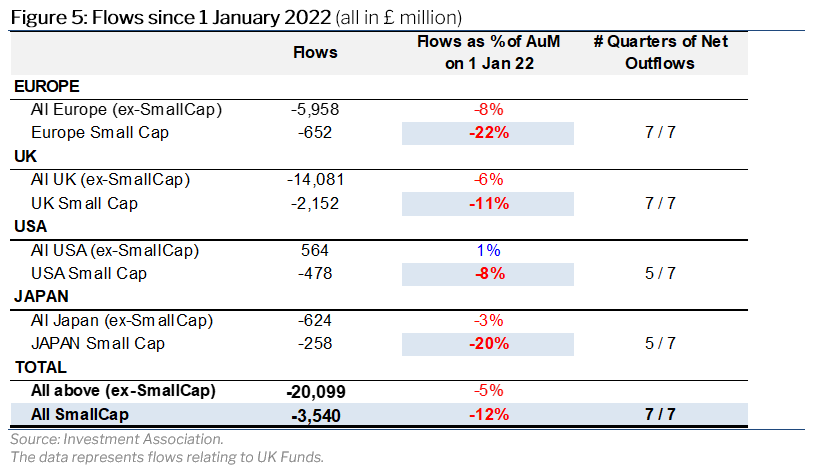
- Flows (Figure 5) – According to the Investment Association, flows have been overwhelmingly negative across SmallCap Funds since the start of 2022, totaling £3.5 billion across European, UK, US and Japanese strategies – the equivalent of 12% of starting AuM. Across all markets, SmallCap Funds have seen larger outflows than traditional AllCap and income equity Funds as a % of AuM.
 GLOBAL SmallCap
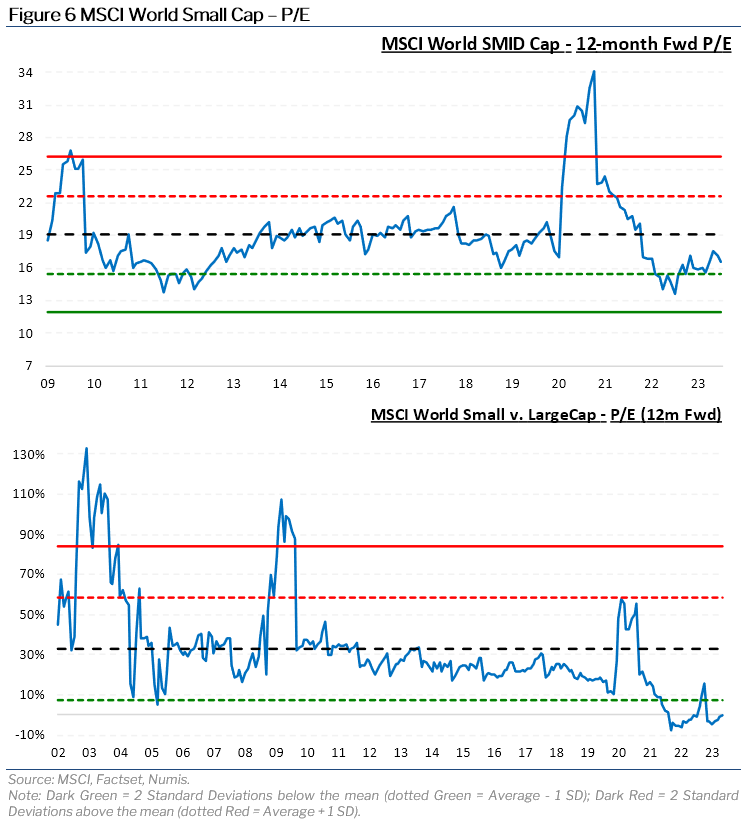
 PAN-EUROPE SmallCap
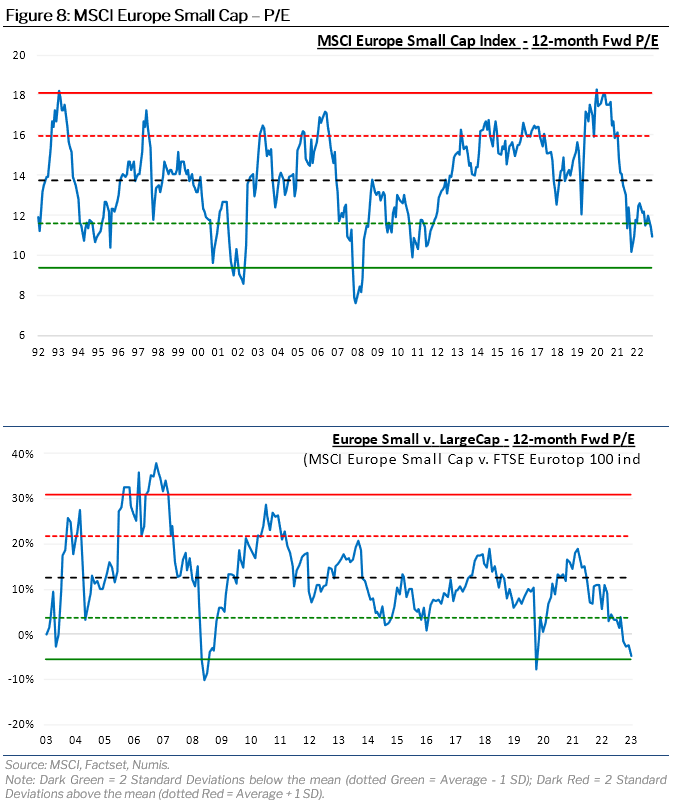
 EUROPE ex-UK SmallCap
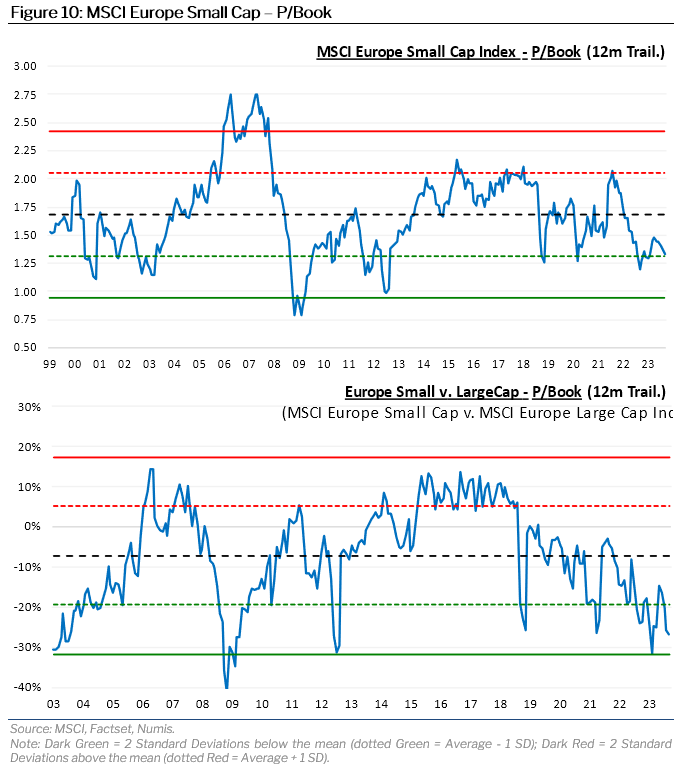
 UK SmallCap