

Why investors should be looking at SmallCap now
Executive Summary
The reason we wanted to write this Blog is simple: it is hard to recall the last time there was such indifference to our asset class, quoted SmallCap. For the past 18 months, performance has been weak, valuations have been compressing and flows across the industry have been negative. For the same reason, it is hard not to be excited about the investment opportunity that the asset class offers today. The conditions for SmallCap to start outperforming – and possibly in a spectacular manner – are rapidly falling into place.
- SmallCap has outperformed LargeCap in all major regions over the long run – SmallCap has outperformed LargeCap by 1.7% per annum in the US since 1926 and by 3.1% p.a. in the UK since 1954. Since the turn of the century, the strongest outperformances have been observed in Continental Europe (4.8% p.a.) and Japan (4.0% p.a.).
- BUT: the past 18 months have been awful, even by historical standards – And although this is true of every major SmallCap market on the planet, the UK stands out for its particularly dismal record: UK SmallCap has underperformed in 14 of the past 18 months, a figure that hasn’t been seen since records began in the 1950s.
- Inflation: from headwind to tailwind? – As a long duration asset class, given its higher growth, SmallCap typically underperforms when inflation suddenly shoots up and accelerates, as in 2022. However, the reverse is also true: SmallCap tends to benefit in a disinflationary environment. If we are right that global inflation has stabilized, then SmallCap should benefit from this extra tailwind
- The right time to play the economic cycle? – Tactically, investors should seek to add to their SmallCap exposure before the economic recovery is in full swing. The UK Leading Indicator (which is a composite indicator that helps predict future changes in economic conditions) has only been lower than today 10% of the time in the past 52 years. If the historical relationship holds true, now is the time to consider adding to SmallCap allocations.
- Valuations are compelling – SmallCap is trading at a discount to LargeCap on both P/Book and P/E and across all markets. In most cases, we are between 1 and 2 standard deviations below the long-term average.
- Expect to see more M&A – Since SmallCap is cheap, you would expect take-over activity to pick up. Already there are signs that M&A activity is indeed rearing its head again. Private equity is sitting on record levels of cash, ready to pounce.
The Size Premium (or “SmallCap Effect”) – the long run
The Size Premium (also known as the “Small Firm Effect” or “SmallCap Effect”) first came to prominence in the US in 1981 when Rolf Banz, a Swiss economist, published a groundbreaking study titled “The Relationship Between Return and Market Value of Common Stocks” in the Journal of Financial Economics. In this study, Banz examined the performance of stocks listed on the NYSE from 1936 to 1975 and found that, on average, US SmallCap outperformed LargeCap over the long term, even after accounting for risk.
Forty years after the findings from Banz, the SmallCap Effect remains alive and well. The chart below from Ibbotson / Morningstar shows that $1 invested in US SmallCap in 1926 would have been worth $49,052 by the end of 2022, compared to only $11,535 had it been invested in LargeCap instead (and only $131 in Bonds). This equates to an annualised return of 11.8% and a SmallCap Effect of 1.7% p.a..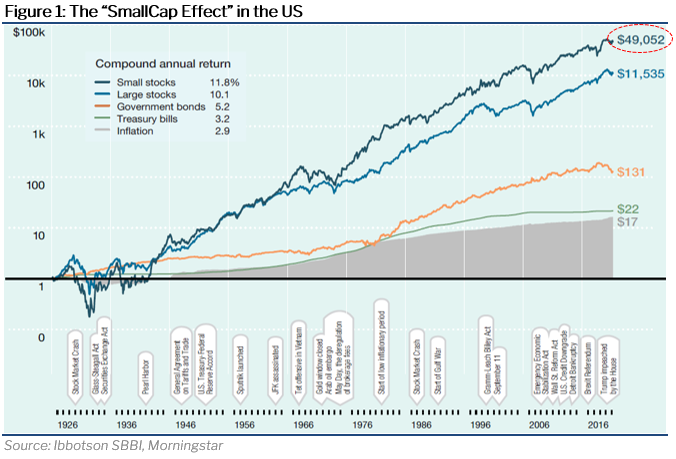 A few years later, Elroy Dimson and Paul Marsh of the London Business School published their own research confirming the existence of a persistent SmallCap Effect in the UK. Between 1954 to 2022, UK SmallCap outperformed LargeCap by an average of 3.1% per annum. When compounded over time, this means it has produced returns almost seven times greater since 1954.
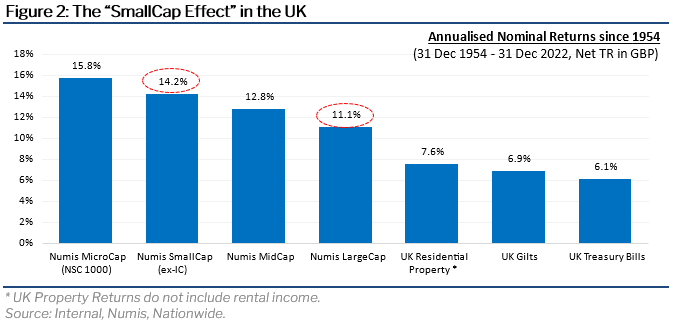 These figures suggest that SmallCap is a good asset class for investors with a long-term horizon. Importantly, the outperformance has not come from a handful of extraordinarily strong months (which would be easy to miss) but from the compounding of incremental outperformance earned time and time again. The example of the UK, as shown in Figure 3, is illustrative in that regard: whilst SmallCap has outperformed in just over half the 819 months since January 1955, it has outperformed in 78% of the (700) 10-year rolling periods and in 99% of the (460) 30-year rolling periods.
 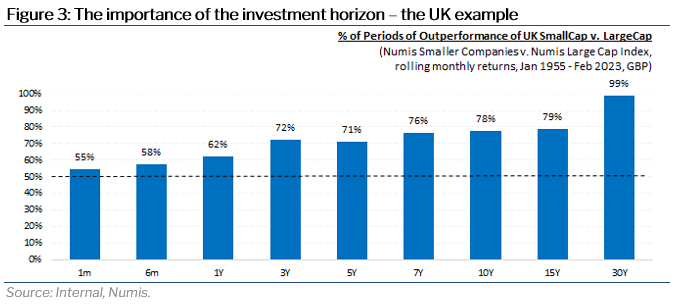 While the SmallCap Effect was first documented in the US and the UK, it also exists in most markets around the world (Taiwan – where the company TSMC singlehandedly makes up more than half of the MSCI Taiwan Large Cap Index – is the only exception we are aware of). Indeed, since the turn of the century (or more precisely from 31 December 2000, when many of the regional MSCI SmallCap indices first launched), Global SmallCap has outperformed LargeCap by 2.8% per annum on average (see Figure 4 below). Investors who had been invested in SmallCap throughout this period would have enjoyed a cumulative return three times higher than in LargeCap.
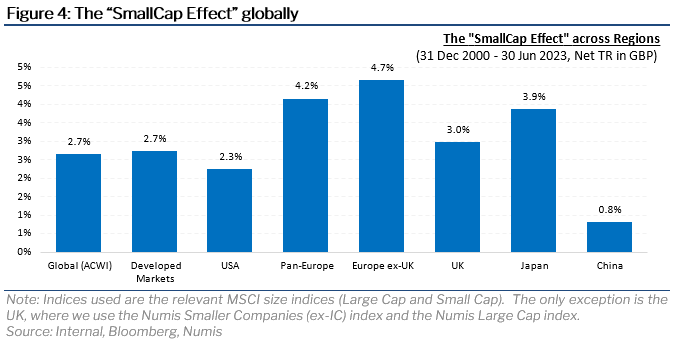 Ever since 1981, a plethora of academic studies has attempted to extend, clarify and in some cases contest these early findings. We do not want to venture into the world of academia here, but it is worth pausing to discuss one aspect that scholars have focused on in particular: risk. There is a long-held belief in finance that the more risk you take, the higher the return – and vice versa. Whilst this is true in SmallCap, we show below that SmallCap investors have been more than compensated for the higher volatility. The sole exception is the US, where the rise of the FAANGs had a disproportionately positive impact on the return-to-risk ratio of LargeCap from 2009.
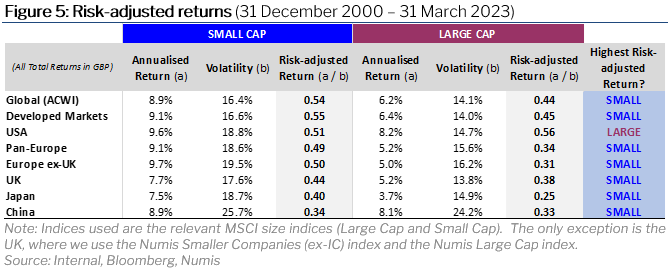 The Size Premium in the post-COVID era
Despite a strong track record of outperformance over the long run, the SmallCap Effect is, like every other style, subject to reversals from time to time. It does not outperform all of the time. There are periods of underperformance, which tend to coincide with periods of rapidly rising inflation / interest rates or economic weakness (see next sections).
Figure 6 shows that the past 18 months have seen such a reversal, with SmallCap underperforming LargeCap across all regions – and significantly so. In the UK, the Numis Smaller Companies (ex-IC) index has lagged the Numis LargeCap index by a whopping 26%, the worst such underperformance since 1998 – a once-in-a-generation event. Figure 7 looks at the recent weakness through a different lens. The first chart shows that Global SmallCap has underperformed LargeCap in 10 of the past 18 months while Pan-European SmallCap has underperformed in 13 of the past 18 months, a particularly dreadful record which has been only exceeded a handful of times before. The UK, however, stands out once again as the outlier: with underperformance in 14 of the past 18 months, UK SmallCap is writing new pages in the history books.
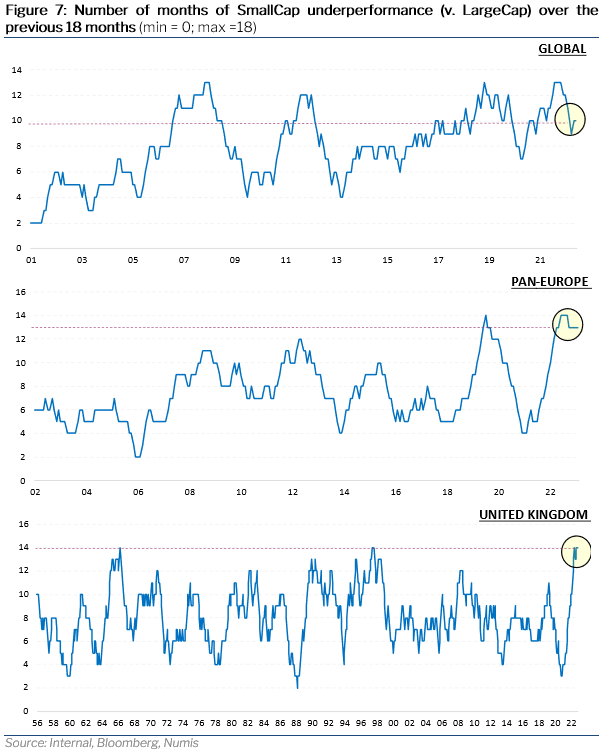 Inflation – headwind or tailwind?
As a long duration asset class, due to its higher growth, SmallCap is typically more sensitive than LargeCap to changes in inflation and interest rates. History shows this has been especially true when these changes were sudden, sharp and unexpected.
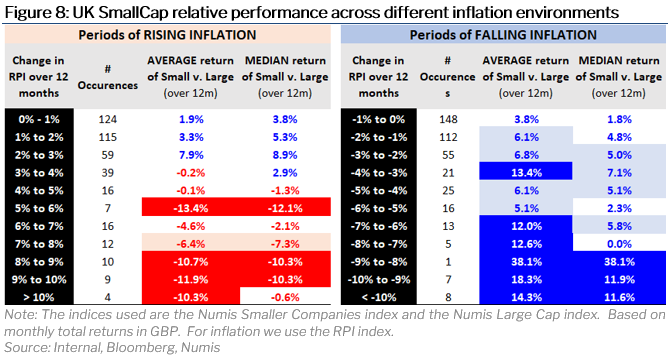
To illustrate this, we use data from the UK, where we have the longest and most consistent – time series, going back to December 1954. Figure 8 shows that:
- SmallCap typically underperforms LargeCap when inflation rises by more than 4% (or 400 basis points) over a 12-month period. As inflation further accelerates, the scale of SmallCap’s underperformance increases accordingly. In 2022, inflation in the UK rose by almost 600bp, resulting in SmallCap underperforming by 19% – its worst relative year since 1998.
- On average, SmallCap outperforms in normal inflation environments (i.e. when RPI is between 0% and 4%).
- The faster inflation falls, the more SmallCap outperforms. When the decline was in excess of 7% (or 700bp) over 12 months, the outperformance of SmallCap averaged double-digit figures. Such examples include the disinflations of 1976, 1978 and 1981 (in August 1976 the RPI fell by 910bp compared to the previous year, coinciding with SmallCap outperforming by a remarkable 21%).
 We are not economists, but there are good reasons to believe that inflation has peaked on both sides of the Atlantic. Figure 9 shows current inflation projections in the UK, as compiled by Bloomberg and based on the assumptions implied by interest rate derivatives. Fixed income investors are expecting CPI to decline from a peak of 10.2% in December 2022 to 4.2% by the end of 2023, 3.5% by March 2024 and 1.6% by June 2024. In all three cases, this would represent a decline of more than 6% (600bp) in inflation over 12 months, suggesting potential outperformance of c.12% for SmallCap according to the table above.
 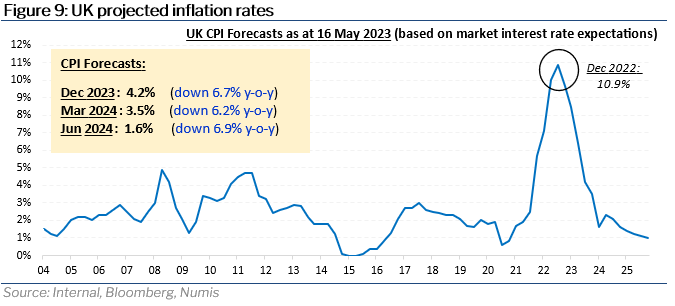 Economic Cycle
Most SmallCap indices have a higher weighting in cyclical sectors, such as industrials, technology, and consumer discretionary. As a result, SmallCap tends to be more geared to the economic cycle than LargeCap. Tactically, investors should therefore seek to add to their SmallCap exposure before the economic recovery is in full swing.
Figure 10 illustrates the correlation between economic sentiment and SmallCap’s relative performance (once again we use the UK as an example). The relationship is clear to the naked eye: both lines move in lockstep. In other words, when the Leading Indicator (the purple line) moves higher, SmallCap tends to outperform LargeCap, and vice versa.
Although the purple line is not quite at depressed levels (the worst ever readings came in November 1974 at -16.6 and May 2020 at -18.4), it firmly sits in negative territory at -7. It has only been lower than today 10% of the time in the past 52 years. If the historical relationship holds true, now is the time to considering adding to your SmallCap allocations.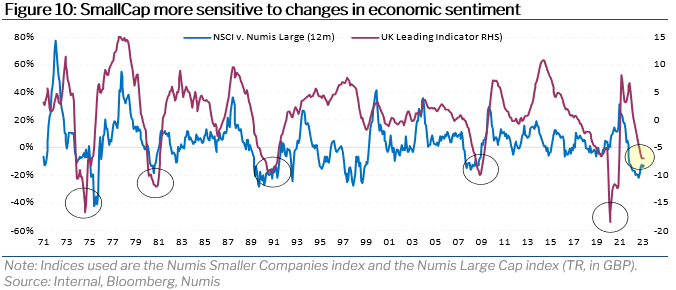 Valuations are compelling
Unsurprisingly, weak performance has translated into increasingly depressed – and thus increasingly attractive – valuations for SmallCap. Figure 11 shows that on P/Book, all SmallCap markets are trading below their long-term average, with the crown going once again to the UK (17% below average).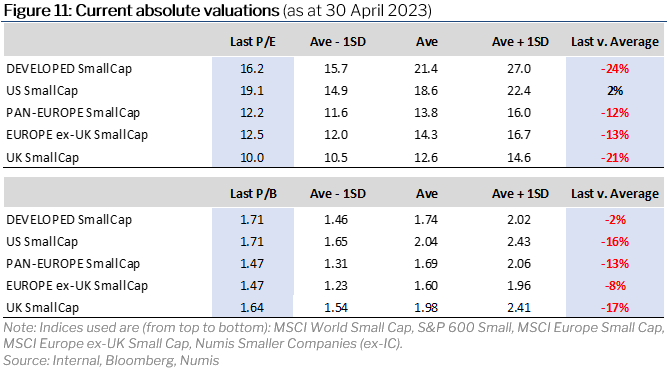 Similar conclusions can be drawn from relative valuation figures, i.e. when comparing SmallCap to LargeCap. SmallCap is trading at a discount to LargeCap on both P/Book and P/E and across all markets. In most cases, we are between 1 and 2 standard deviations below the long-term average.
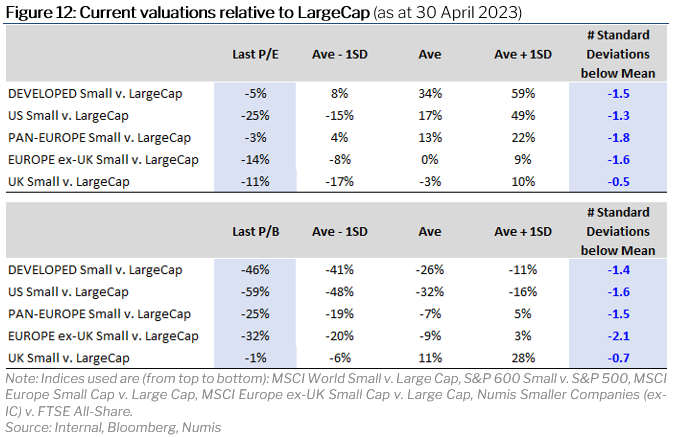 M&A activity – another tailwind?
Since SmallCap is cheap, you would expect take-over activity to pick up. Already there are signs that M&A activity is rearing its head again. Indeed, several of our holdings – Ideagen, Dechra, Biffa, EcoOnline, Christian Hansen, Simcorp and Brewin Dolphin, to name a few – received bids in the past 18 months.
As we entered 2023, the private equity industry braced itself for many changes, including higher interest rates, lower valuations, weaker equity markets and fewer exit opportunities. However, one key element remains stubbornly unchanged – dry powder levels amongst private equity players. As shown below, this dry powder stood at a record of $3.7 trillion globally at the end of 2022. Bain observes that the sheer magnitude of undeployed private capital is maintaining upward valuation pressure on any high-quality deal. 65% of North American buyouts in 2022 involved multiple bidders or a formal auction process. Good quality Smaller Companies are likely to receive more attention in the coming months. 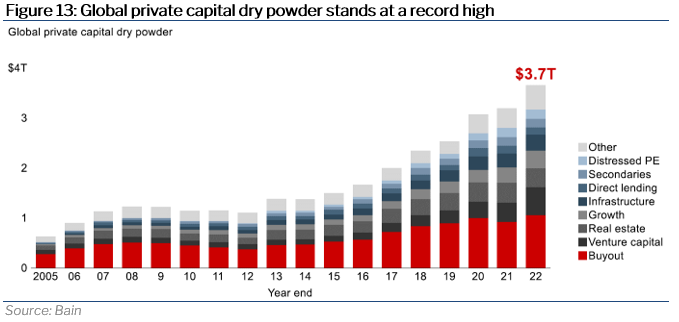 Conclusions
The past 18 months have been awful for SmallCap, even by historical standards. Yet there are signs that the conditions for the asset class to start outperforming – and possibly in a spectacular manner – are rapidly falling into place. Nathan Rothschild, the 19th-century British financier, is credited with saying that “the time to buy is when there’s blood in the streets.” Well, that time may well be now.