

The Unloved Market
What links 2010, 2011, 2012, 2014, 2015, 2016, 2017 and 2018? The answer is that in each year, the worst selling asset class among UK retail investors was the UK All Companies sector. Put another way, during the long bull market that started a decade ago, UK equities have been the unloved market.
The consistency of this is so remarkable that it is worth absorbing the table below from the Investment Association:
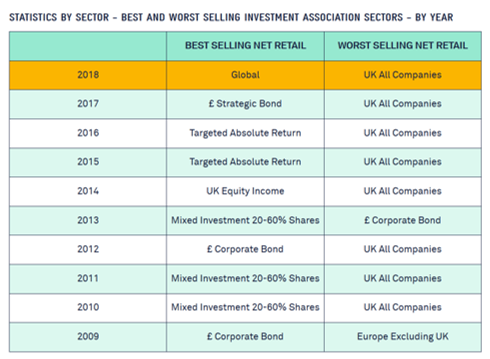
Within the UK, SmallCap has been the ugly duckling. Since the Global Financial Crisis, more than £2 billion of net flows have streamed out of the UK’s smaller companies. Although these have trickled into positive territory over the last couple of years, it is clear that UK SmallCap is monumentally under-owned. (2013 was a risk-on year following Mario Draghi’s “whatever it takes” speech).

There are three compelling reasons for thinking the time may be right for investors to address this severe underweight.
The first is currency. Over the last 5 years, sterling has fallen by a staggering 23% versus the US dollar. Much of this occurred in the immediate aftermath of the Brexit referendum when the pound slumped to a 31-year low. What UK exposure investors had was swiftly tilted towards the beneficiaries of a weaker pound: LargeCap businesses who source so much of their earnings from overseas.
But what is good can turn bad. A strengthening pound will lessen the power of overseas earnings and hurt the performance of sterling denominated investment portfolios that remain significantly underweight the domestic UK. There are tentative signs that sterling is recovering. The currency has increased by 2% this year versus the US dollar and 4% versus the euro. A breakthrough in Brexit negotiations may act as an accelerator (see Currency speculators have turned positive on the pound’s prospects in the Financial Times).
The second is valuation. The UK SmallCap P/E ratio sits below its long-term average of 13.5x. It trades at a discount of 5% to UK LargeCap (and even a 20% discount to European SmallCap – a market that is not exactly “hot”). This, despite the fact that consensus earnings expectations for UK SmallCap are significantly higher than LargeCap (8.6% versus 4.1% over the next 12 months).
Another indication of the relative value of UK equities is demonstrated in the graph below. Remembering the inverse relationship between yields and price, it is quite something that UK equities now yield 350 basis points more than gilts, a level not seen since the reign of Queen Victoria.

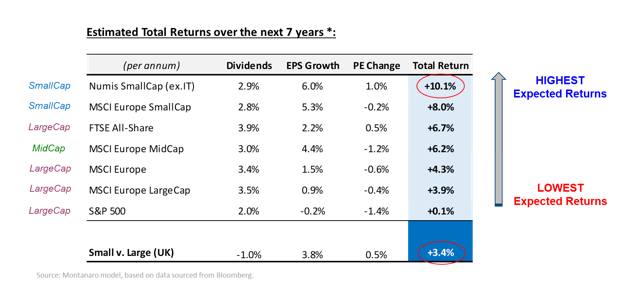
This brings us to our third and final point: returns. We have calculated future returns based on three components which are we assume mean-revert over time (these are our own assumptions): 1) dividend yield, 2) EPS Growth (calculated as sales growth + profit margin change), and 3) PE ratio re-rating (excluding loss-markers). The results of this are striking and suggest that over the next 7 years UK SmallCap offers the strongest per annum return of 10.1%. This equates to a SmallCap Effect of 3.4%, a higher level than we have seen over the past half-century.
Investors who address their extreme underweight to domestic UK stocks are arguably reducing currency risk at a time of historically attractive valuations, for better returns.
Sources: Montanaro; Bloomberg; Barclays Equity Gilt Study; Numis.