

Proteomics: Biology’s Coming of Age Moment
An overview of the key technologies, players, and opportunities in the coming decade
Executive Summary
The growth of research activity in the field of proteomics appears to be on a similar trajectory to the early days of genomics, which took around a decade to industrialize. Proteomics methods have been emerging for longer than genomics, which is consistent with the greater relative complexity of the proteome requiring more advanced technology compared to genomics. Today, however, significant bottlenecks are being overcome, and this is giving scientists line of sight to proteomics reaching an equivalent level of research, translational, and clinical significance as genomics. The commercial opportunity of proteomic applications both in research and in the clinic should therefore be expected to converge to the size of the genomics TAM over time, with reason to believe that it could surpass it on account of the dynamic, changing nature of the proteome, which translates to recurring and repeating clinical activity.
Mass spectrometry is the technology most able to facilitate this industrialization of proteomics, but there remain challenges in the standardisation of workflows, particularly in sample preparation stages. Vendors with differentiated IP throughout this ecosystem should be of great interest to long-term investors. Emerging methods like high-plex analyte-based assays also hold enormous potential, albeit these are at an earlier stage than mass spectrometry.
Background & Investment Thesis
The fundamental building blocks of biological life are nucleic acids and amino acids. Nucleic acids are the building blocks for genes. Amino acids are the building blocks for proteins. In fact, every cell in our bodies boils down to either a protein, a gene, a lipid, or a carbohydrate. These are the four macromolecular groups. Lipids and carbohydrates are simple and not much goes wrong. What matters the most, therefore, is understanding genes and proteins.
Our understanding of human biology, from cell function to disease causation, to drug treatment, is therefore a derivative of our knowledge of genomics and proteomics.
In basic terms, since the invention of advanced microscopic and certain biochemistry techniques in the 20th Century, our understanding of proteins and genes within structural biology has advanced considerably.
In the 21st Century, genomics has seen a revolution that has taken it from a fledgling field of research to an industrialized sector of clinical biology, responsible for not only new depths of biological understanding but new classes of clinical therapeutics and diagnostics, from liquid biopsy diagnostics to Car-T cell therapies and even mRNA vaccines.
Proteomics has also made important advances in the 21st century on account of not only new techniques in imaging like mass spectrometry and X-Ray crystallography, but also from biochemistry innovation in immunoassay reagents, allowing the isolation of certain proteins to be studied further.
But unlike genomics, proteomics has not taken the leap into its next frontier. It remains in the foothills. This has nothing to do with its relative promise or utility relative to genomics – only its complexity. We posit that the next decade will see proteomics enter the fast lane, which will usher in a new protein-centric age in biological research, medical treatment and diagnostics.
The Challenge of Proteomics: More than 95% of FDA approved drugs work by targeting proteins, and yet the majority of the proteome is not understood.
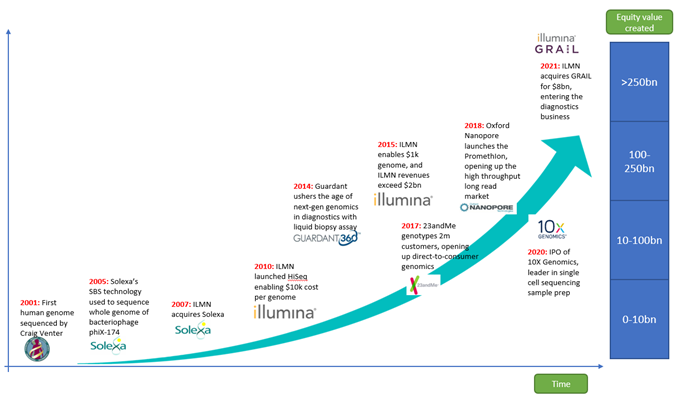
We believe that ten years from now, the equity value created by proteomics companies in the West will be comparable to or more than the ~$250bn in market cap from genomics-based companies today.
The rate of innovation is speeding up:
- It took 85 years for Watson and Crick to discover the DNA double helix in 1953, since nucleic acid was first discovered in 1869 by Friedrich Miescher.
- It then took 50 years between Watson and Crick’s discovery and the first human genome sequence being published in 2001.
- It then took 20 years between the first draft of the human genome in 2001 and the first fully end-to-end sequence without gaps, published in July 2021.
- All in all, that’s 155 years from nucleic acid discovery to complete human genome. The next 155 years will see an exponentially higher rate of innovation, and proteomics will be the biggest beneficiary
Proteomics Today: Challenges & Opportunities
What is proteomics and why is it important?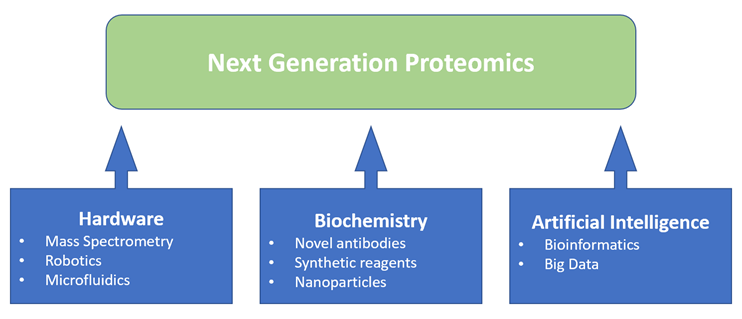 Figure1: Proteomics is benefiting from a convergence of enabling technologies
Proteomics as a term was first coined in 1996, and is defined as the large-scale characterization of the entire protein map of a cell line.
The point of proteomics is comprehensibility and depth: to gain a thorough understanding of cell function by detecting and understanding all the proteins in that cell and all their roles and interactions, rather than simply detecting each protein individually, which is the historic method involving isolating known proteins using antibodies.
Antibody-based protein detection will continue to be useful for follow-up work, but proteomics is about unlocking the large scale, high throughput, high sensitivity analysis of all proteins, their interactions, and their many altered proteoforms. This is incredibly important for understanding disease causation because it is typically when protein modifications and interactions go wrong that diseases occur. 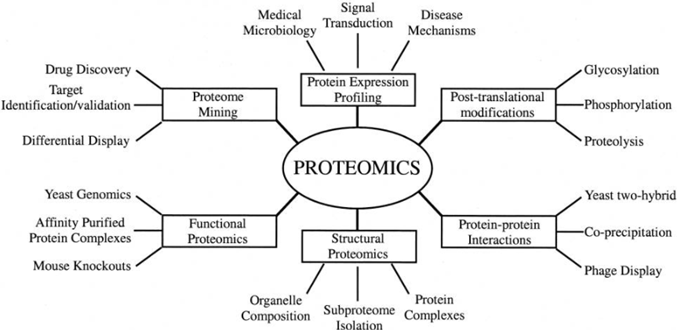 Source: Graves PR, Haystead TA., Molecular biologist’s Guide to Proteomics (2002)
What is the relationship between Proteomics and Genomics?
When Mark Wilkins first used the term proteomics in 1996, he made clear that he was referring to a ‘complement of the genome’.
Genes consist of the instruction manuals for cells. Through RNA expression they instruct the cells on which proteins to build. The proteins then get built according to the genetic instruction, after which they get modified post-translationally by interacting with other proteins and their environment.
So, 1) most of the functional utility of genomics is expressed in the proteome; and 2) what happens subsequently – namely, protein-to-protein interactions and the dynamic creation of new proteoforms and modifications which in turn regulate cell division, is the subject of proteomics, not genomics.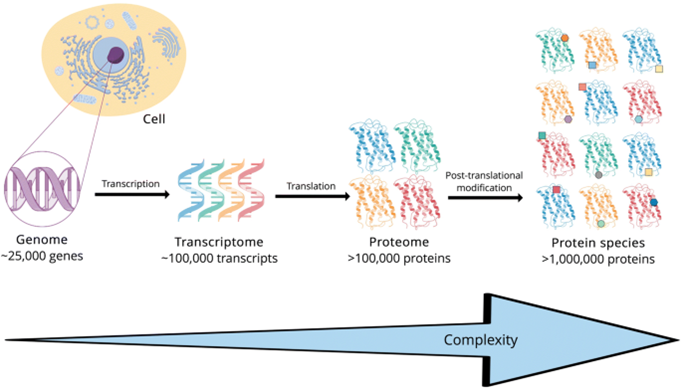 Source: Virag D, Dalmadi K B. Current Trends in the Analysis of Post-translational Modifications (2020)
So genomics and proteomics are interrelated, not separate, but proteomics is much more functionally important, and complex.
- There are 25k separate genes, but there are over 1 million proteoforms.
- While one’s genome does not change; one’s proteome is dynamic. If something changes in the body, it’s protein modifications that it gets expressed through. You had the same genome when you were born as you do today. But your proteome changes every day.
Why is Proteomics so difficult?
- Complexity and diversity of molecules
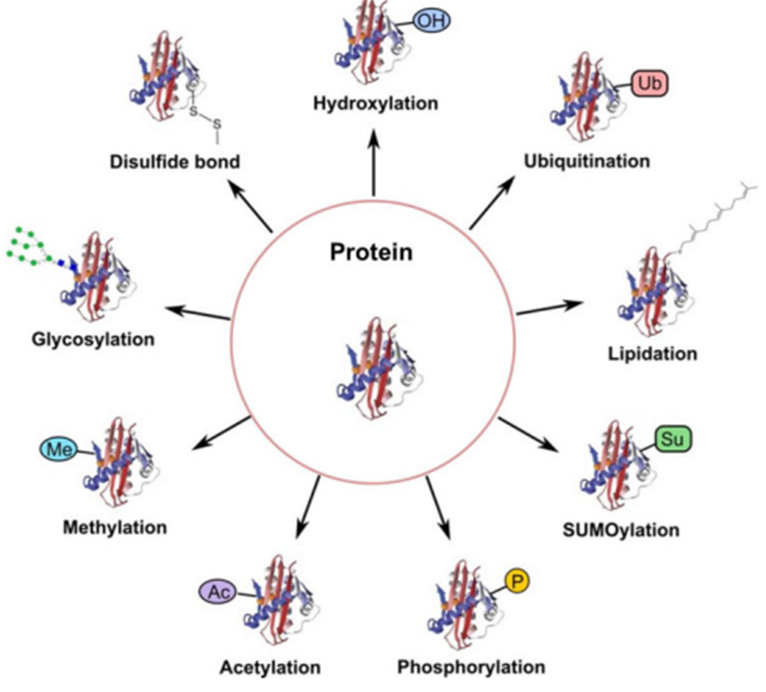 Source: Creative-Proteomics.com
- Protein molecules themselves are more complex in molecular structure. While DNA is made up of 4 nucleotide bases, proteins are made up of 20 different amino acids.
- Post-translational modifications like methylation and hydroxylation change the proteoform and function.
- Each individual protein can take the form of 9 different proteoforms depending on the post-translational modifications and the protein-to-protein interactions that take place. This means the same protein can have 9 different functions.
- DNA’s relative molecular simplicity, with its 4 nucleotide variants, means that gene sequencing methods like sequencing-by-synthesis cannot be applied to the proteome. New, more sophisticated, and more complex/bespoke methods are required to capture the many millions of different proteoforms in a biological sample.
- The dynamic range problem
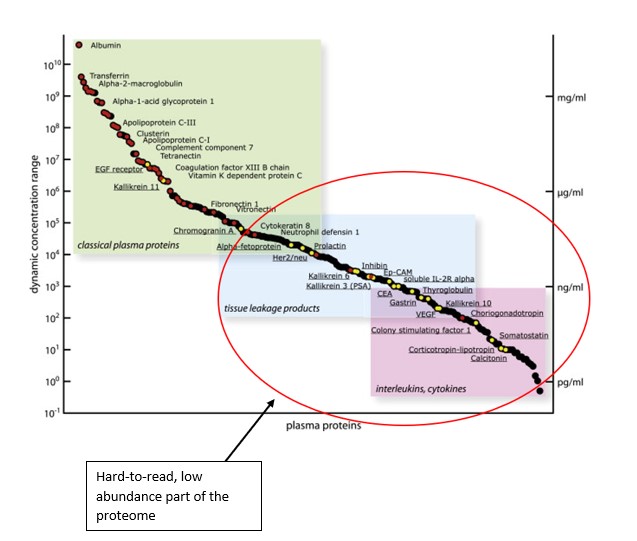 Source: Montanaro Research; Aebersold R., Targeted Proteomic Strategy for Clinical Biomarker Discovery (2009)
The Y axis indicates concentration and abundance of a particular protein molecule in a blood plasma sample. The problem with proteins is that while some are extremely abundant, most protein types are present in tiny or even negligible concentration.
The proteins in the red circle exist in the ‘dark corner’ of the proteome which is incredibly difficult to access based on this extremely low abundance.
The majority of proteins are in extremely low abundance. Out of ~12,000 separate proteins found in plasma cells, the top 10 account for 90% of the total protein volume, while the other ~11,990 account for only 10%.
Tyranny of the Minority: pie chart showing relative abundance of proteins in a plasma sample.
A single protein, Albumin, accounts for 57% of the volume, making it harder to read the remaining 10k proteins.
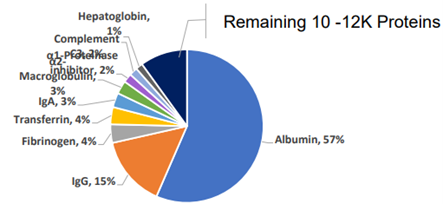 Source: Anderson NG., Molecular Cell Proteomics (2002)
What is the TAM & Size of the Opportunity?
- We believe proteomics has just as much promise as genomics in both molecular biological research, and in clinical medicine and diagnostics.
 Source: Montanaro Research
Since the assembly of the first human genome in 2001, Genomics has become an industrialized part of biomedicine, with pure-play genomics companies making up a collective market cap of $240bn. The largest of these is Illumina.
Proteomics TAM (Total Addressable Market) today is already in the tens of billions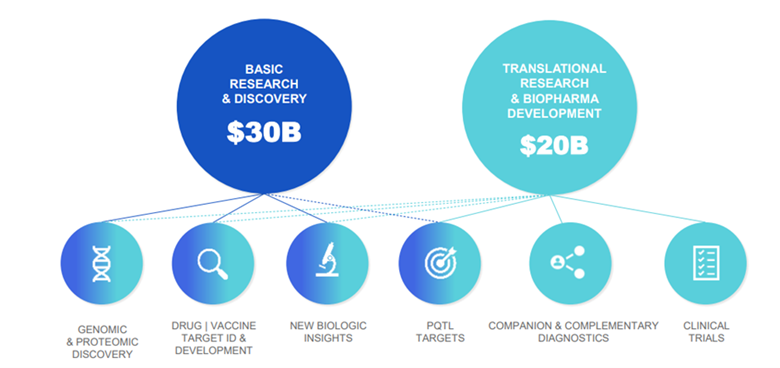 Somalogic estimate the total TAM to be $50bn (Source: Somalogic)
- While the clinical TAM has the most long-term potential, it is the Research & Discovery TAM that is the most immediately addressable in the next 5 years.
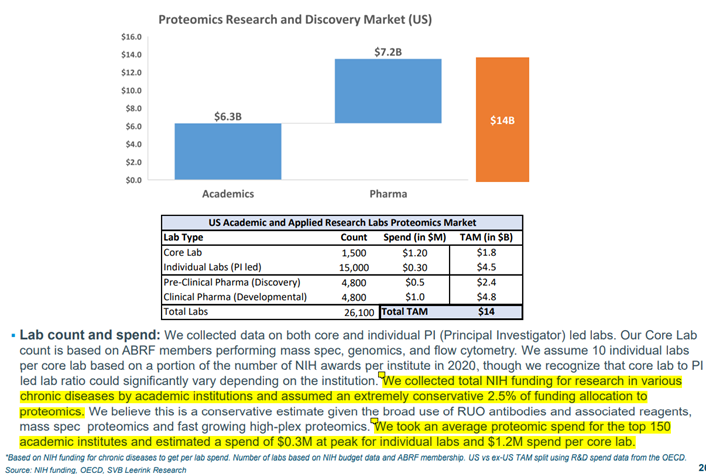 Source: Souda P., Proteomics: The Next Frontier, SVB Leerink (2021)
SVB Leerink’s Proteomics expert, Puneet Souda, estimates the current TAM in R&D for the US alone is $14bn, based on a conservative allocation of 2.5% of funding from the ~26,100 labs across academic and pharma research labs.
If we took the number of labs in the West to be ~50,000 and assumed a more realistic 5% funding allocation to proteomics, we would get to a TAM of > $50bn in global developed economy proteomics R&D.
Key Players: How to Play Proteomics
There are a few ways for investors to play the proteomics revolution
| Ways to play proteomics | Growth Score (1-5) | TAM Size (1-5) |
| Mass Spec Proteomics | 4 | 5 |
| Sample Prep Workflow | 4 | 4 |
| Research Antibodies | 3 | 3 |
| Disruptive Novel Methods | 5 | 4 |
| Spatial Proteomics Tools | 3 | 2 |
- Mass Spectrometry
Key Names:
Bruker (BRKR)
Thermo Fisher (TMO)
Mass Spectrometry is the gold standard for scientific analysis of proteins and peptides for research biomarker discovery.
Mass Spectrometers are instruments used across a range of industries for molecular, chemical and material analysis. Mass Spec relates to a family of instruments that use the same principles for detection: that of identifying a substance by reading the mass-to-charge ration of its ions. But mass spectrometry instruments vary hugely by design, IP and function depending on the market.
In the world of proteomics, there are few manufactures globally that have invented mass spectrometry technologies sophisticated enough to differentiate between molecules as small as single peptides.
They are Bruker, Thermo Fisher Scientific, Agilent, Waters and Sciex (owned by Danaher). Agilent, Waters, and Sciex have a broad portfolio of mass spectrometers that grow organically in the single digits. Most of their portfolios have applications other than proteomics research. Waters, for example, focuses on instruments used for QA/QC (Quality Control) in biologics manufacturing, which require less sensitivity than proteomics research.
The instruments typically used in Proteomics labs are the Q-TOF technology instruments. This is where Sciex, Waters, and Agilent have some instruments for proteomics. But none have been able to compete with Thermo Fisher’s Orbitrap range in the last 15 years.
Third Bridge Expert Transcripts as well as other sources have confirmed that Thermo Fisher owns over 90% market share in the proteomics research mass spec market, thanks to the rate of innovation of its Orbitrap suite.
The following excerpt from an academic article in 2016 by Professor Joshua Coon demonstrates the importance of mass spec technology to unleash the next generation of proteomics.
“Two decades of vigorous mass spectrometry development, including introduction of a new mass analyzer (i.e., the Orbitrap), are beginning to pay off. Today, it is possible to obtain relatively deep measurements of the proteome in a matter of tens of minutes to a few hours. Three manuscripts in this issue of Cell Systems showcase the promise of a new era in large-scale biology in which proteome analysis is the centerpiece. Together, these studies exemplify how proteomics is poised to deliver new insights in biomedical research at a breakneck pace.”[1]
Bruker TimsTOF
- Historically Bruker’s mass spec portfolio was not able to compete technologically with the Q-Tof mass specs of Agilent or Waters (which lost share to Thermo), or indeed to Thermo’s Orbitrap which became the gold standard.
- In 2017 Bruker invented the TimsTOF mass spec, a new mass spec technology optimized for peptide level resolution at high throughput. The TimsTOF was the first important technological disruption in mass spectrometry since the Thermo Fisher Orbitrap.
- The TimsTOF added a fourth dimension to proteomics through the separation of peptides that takes place in the gas phase in Bruker’s linear accelerator, which shows ion mobility separation on top of just the mass resolution shown by Orbitrap.
- Bruker think there are about 10,000 proteins that matter in transcriptomics coding, and the TimsTOF is the highest throughput solution in the world – it can measure around 4-8,000 proteins in 20 minutes. Bruker says the goal is 10,000 in 10 minutes.
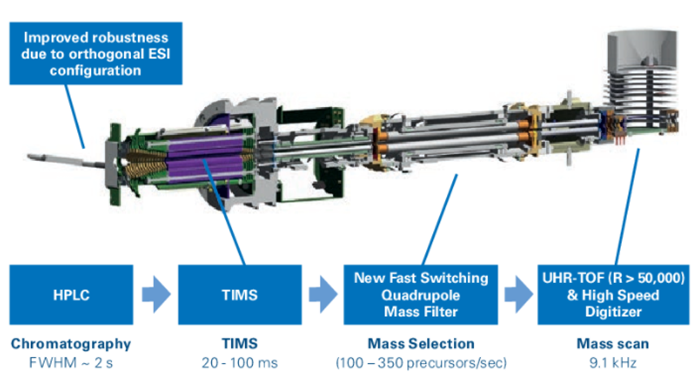 Source: Bruker
 Schema of TimsTOF ionization tunnel coupling trapped ion mobility (TIMS), quadrupole mass filter, and time of flight (TOF) technology in one platform. Source: Montanaro Research (Bruker Site Visit, 2021)
Bruker’s TimsTOF works by trapping and separating the molecules down to the single peptide level using the TIMS tunnel (trapped ion mobility separation), which adds an additional level of separation to the liquid chromatography separation that takes place before the mass spectrometry analysis.
Some of the breakthroughs achieved with Bruker TimsOF:
- High resolution, high throughput characterization of the lipidome from small samples, reported in Nature Jan 2020 by a group led by Professor Florian Meier;
- In 2021, based on collaboration with the Matthias Mann lab at the Max Planck Institute, Bruker released the first world’s single cell mass spectrometer, capable of ultra-high sensitivity detection of thousands of proteins with only a single cell as the input sample.
Bruker’s TimsTof mass specs are the fastest growing mass spectrometry family in global proteomics, gaining market share from Thermo Fisher, and growing at a ~30% rate. From no revenues when TimsTOF was invented in 2017, the TimsTOF mass specs are already approaching a ~$100m run-rate in annual sales, on an installed base of well over 300 instruments.
Conclusion: Bruker is the most investable name in Mass Spectrometry Instruments for Proteomics
What are the bottlenecks we still need to solve to accelerate Mass Spec proteomics?
“The era of practical proteomics—that is, near-complete proteomes within hours rather than days—will focus on improved sample preparation, chromatographic conditions, and data-analysis methods to capitalize on the advances in sensitivity and speed of the newest generations of mass spectrometers.”[2]
Thanks to innovation in mass spectrometry like that of Bruker and Thermo Fisher, we have solved the detection technology, but there remain bottlenecks in the rest of the workflow. The main bottleneck is the sample preparation and liquid chromatography workflows.
- Sample Prep & LC Separation Workflow
Key Names:
Seer (SEER)
Evosep (Private)
Bico (BICO)
Tecan (TECN)
The Proteomics Workflow is a complicated one and involves many steps. This is a simplified workflow:
Step 1: Extraction of protein from sample using lysate
Step 2: Proteins digested using trypsin to break down to peptides
Step 3 Peptide elution & Clean-up
Step 4: Peptide fractionation and separation in liquid chromatography instrument
Step 4: Mass Spectrometry instrument analysis (which includes further peptide separation in the gas phase)
Step 5: Data Analysis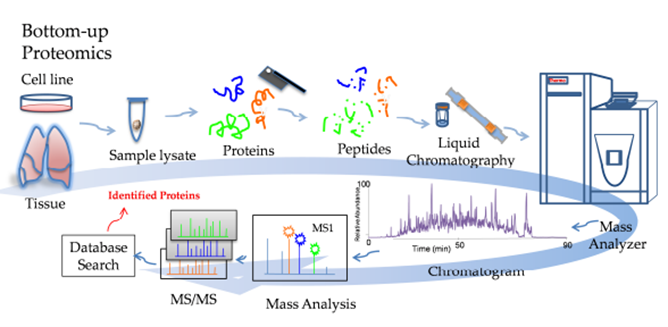 Source: ResearchGate, Mass Spectrometry-Based Bottom-Up Proteomics
Bottleneck: lack of standardisation and throughput in the steps before the mass spec instrument.
In proteomics there are hundreds of thousands of different applications and workflows because each cell type and sample type is so different, and so each requires a different sample prep workflow and mass spec configuration. This opens up opportunities for many entrants.
Key players in the sample prep workflow?
- Sample Extraction/Liquid Handling Players
- Peptide Separation and Detection Players
- Manufacturers of HPLC (High Performance Liquid Chromatographers)
- Specialist Players in Single Cell Sample Prep
Seer (SEER US, 1.4bn Mkt Cap)
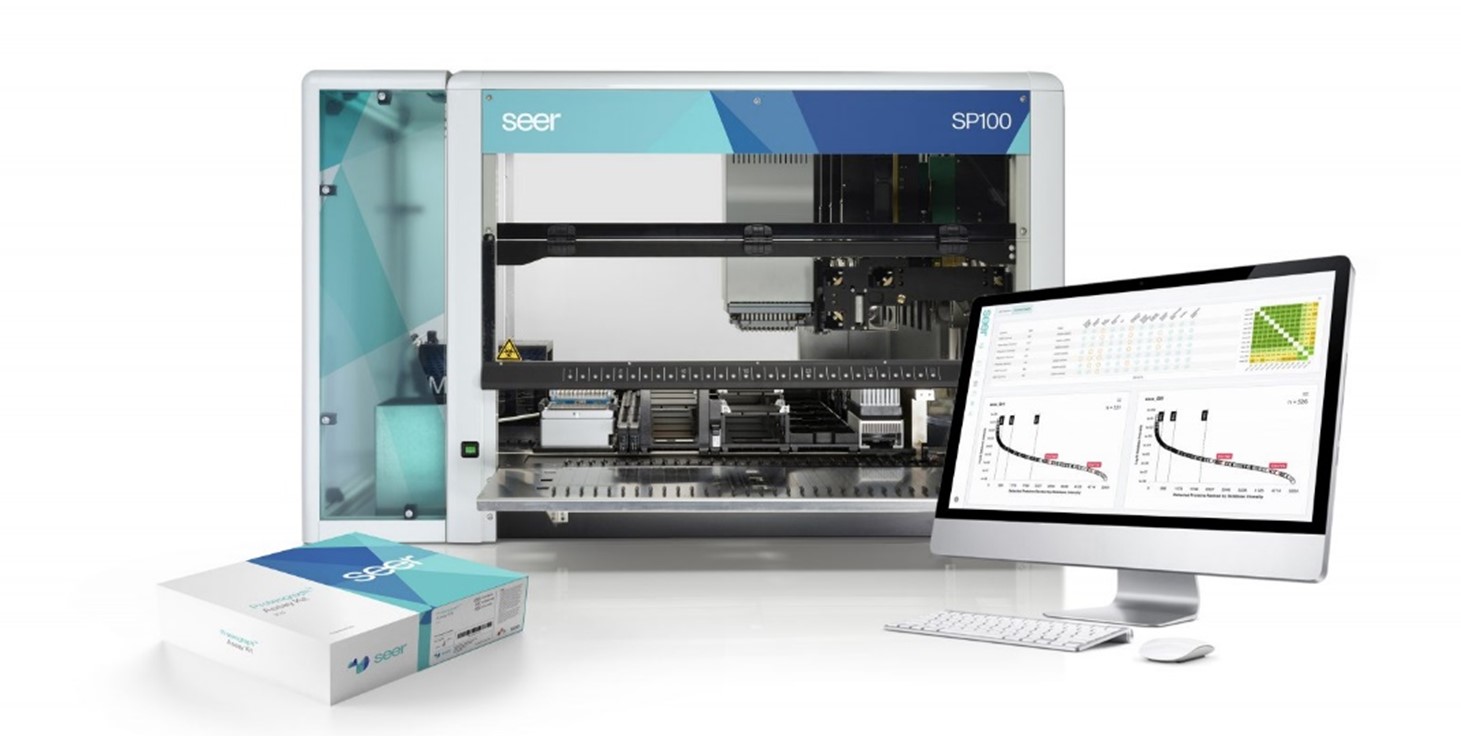
Seer has invented a workflow for standardising the protein digestion and separation stage before it enters the Liquid Chromatography separation.
Seer’s workflow is based on its proprietary nanoparticles which bind to the proteins and group them into 4 along the dynamic range. By doing so, Seer is able to increase the visibility/accessibility of the low abundance proteins.
Seer has partnerships with the two leaders in mass spec: Bruker and ThermoFisher, and leading proteomics labs have shown that the Seer Proteograph does improve the speed and ease of analysis compared to the highly customized lab based methods.
Seer’s publication in Nature gives an excellent overview of the bottle-necks and lack of standardisation in sample prep.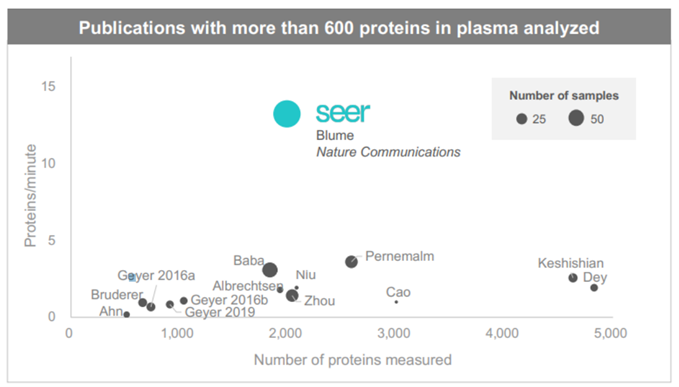 Seer optimizes for throughput over depth of coverage (Source: Seer Investor Relations)
Strengths
- Seer’s nanoparticle IP is differentiated and unique, licensed from Harvard.
- Its nanoparticle groups hugely simplify the workflow, thereby increasing the throughput and time-to-result.
- Increases the visibility of some low abundance proteins, partly solving proteomics’ inability to amplify low abundance molecules through PCR.
- Seer is not totally disruptive; it augments existing Mass Spec workflows, meaning cross-selling into proteomics labs should be simple.
Weaknesses
- Seer’s fate is tied to Mass Spectrometry
- Bruker’s feedback is that Seer’s nanoparticle groupings sacrifice some resolution and depth
 Evosep (Private)
In the Liquid Chromatography phase of the workflow, the most high throughput instrument on the market that has been optimized for very large volume analysis at high sensitivity, is the Evosep One.
We know from our research and speaking to the proteomics community that the Evosep instrument has made the most progress in standardising this part of the workflow and has gained a lot of share from the traditional Liquid Chromatography providers like Waters. We estimate that it has a 60%+ market share in proteomics labs.
However, Evosep does not present an investment opportunity because it is privately held, and has already penetrated its narrow TAM substantially.
We read Evosep’s success as a positive for Bruker because Evosep was founded by a former Bruker R&D team, and the collaboration between the two companies remains strong today.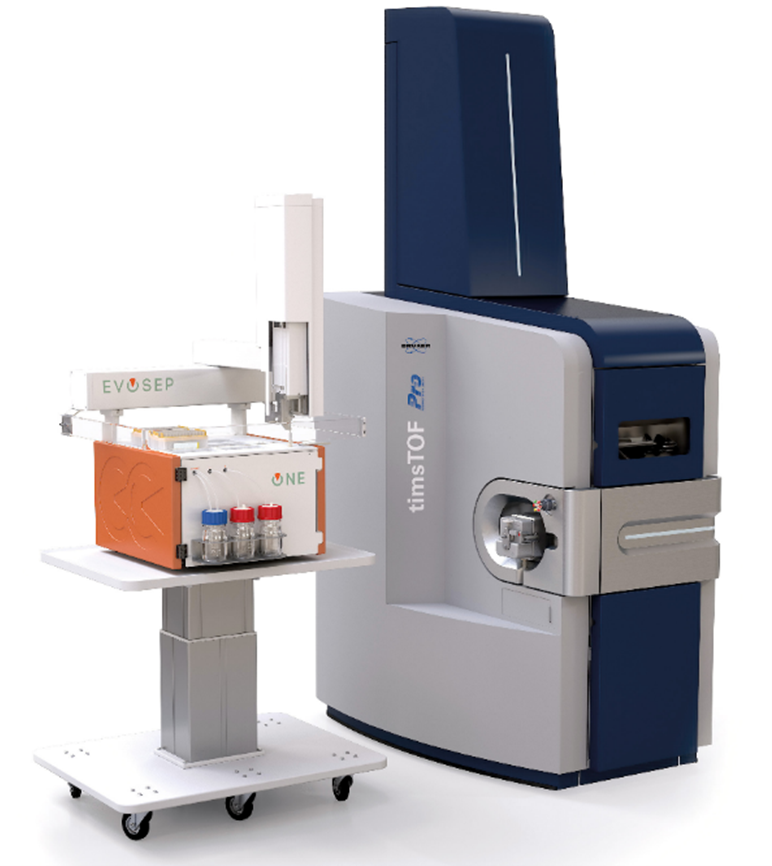 An Evosep instrument (orange) integrated to a Bruker Mass Spec
BICO Group (BICO SS, Mkt Cap $1.6bn)
Cellenion is part of the Bico group of ‘Bioconvergence’ companies. It has a sample extraction automation instrument that is designed specifically for single cell workflows.
Single Cell Mass Spectrometry Proteomics is a cutting-edge field, enabled only this year through the release of the Bruker TimsTof Single Cell Proteomics Mass Spec. Cellenion and Bruker also have a collaboration agreement.
The Cellenion CellenONE platform has IP that relates to single cell isolation and nanoliter dispensing with incredibly precise pipetting and multi-fluorescence image-based single cell sorting. It uses gentle acoustic waves to generate single cell droplets at excellent viability.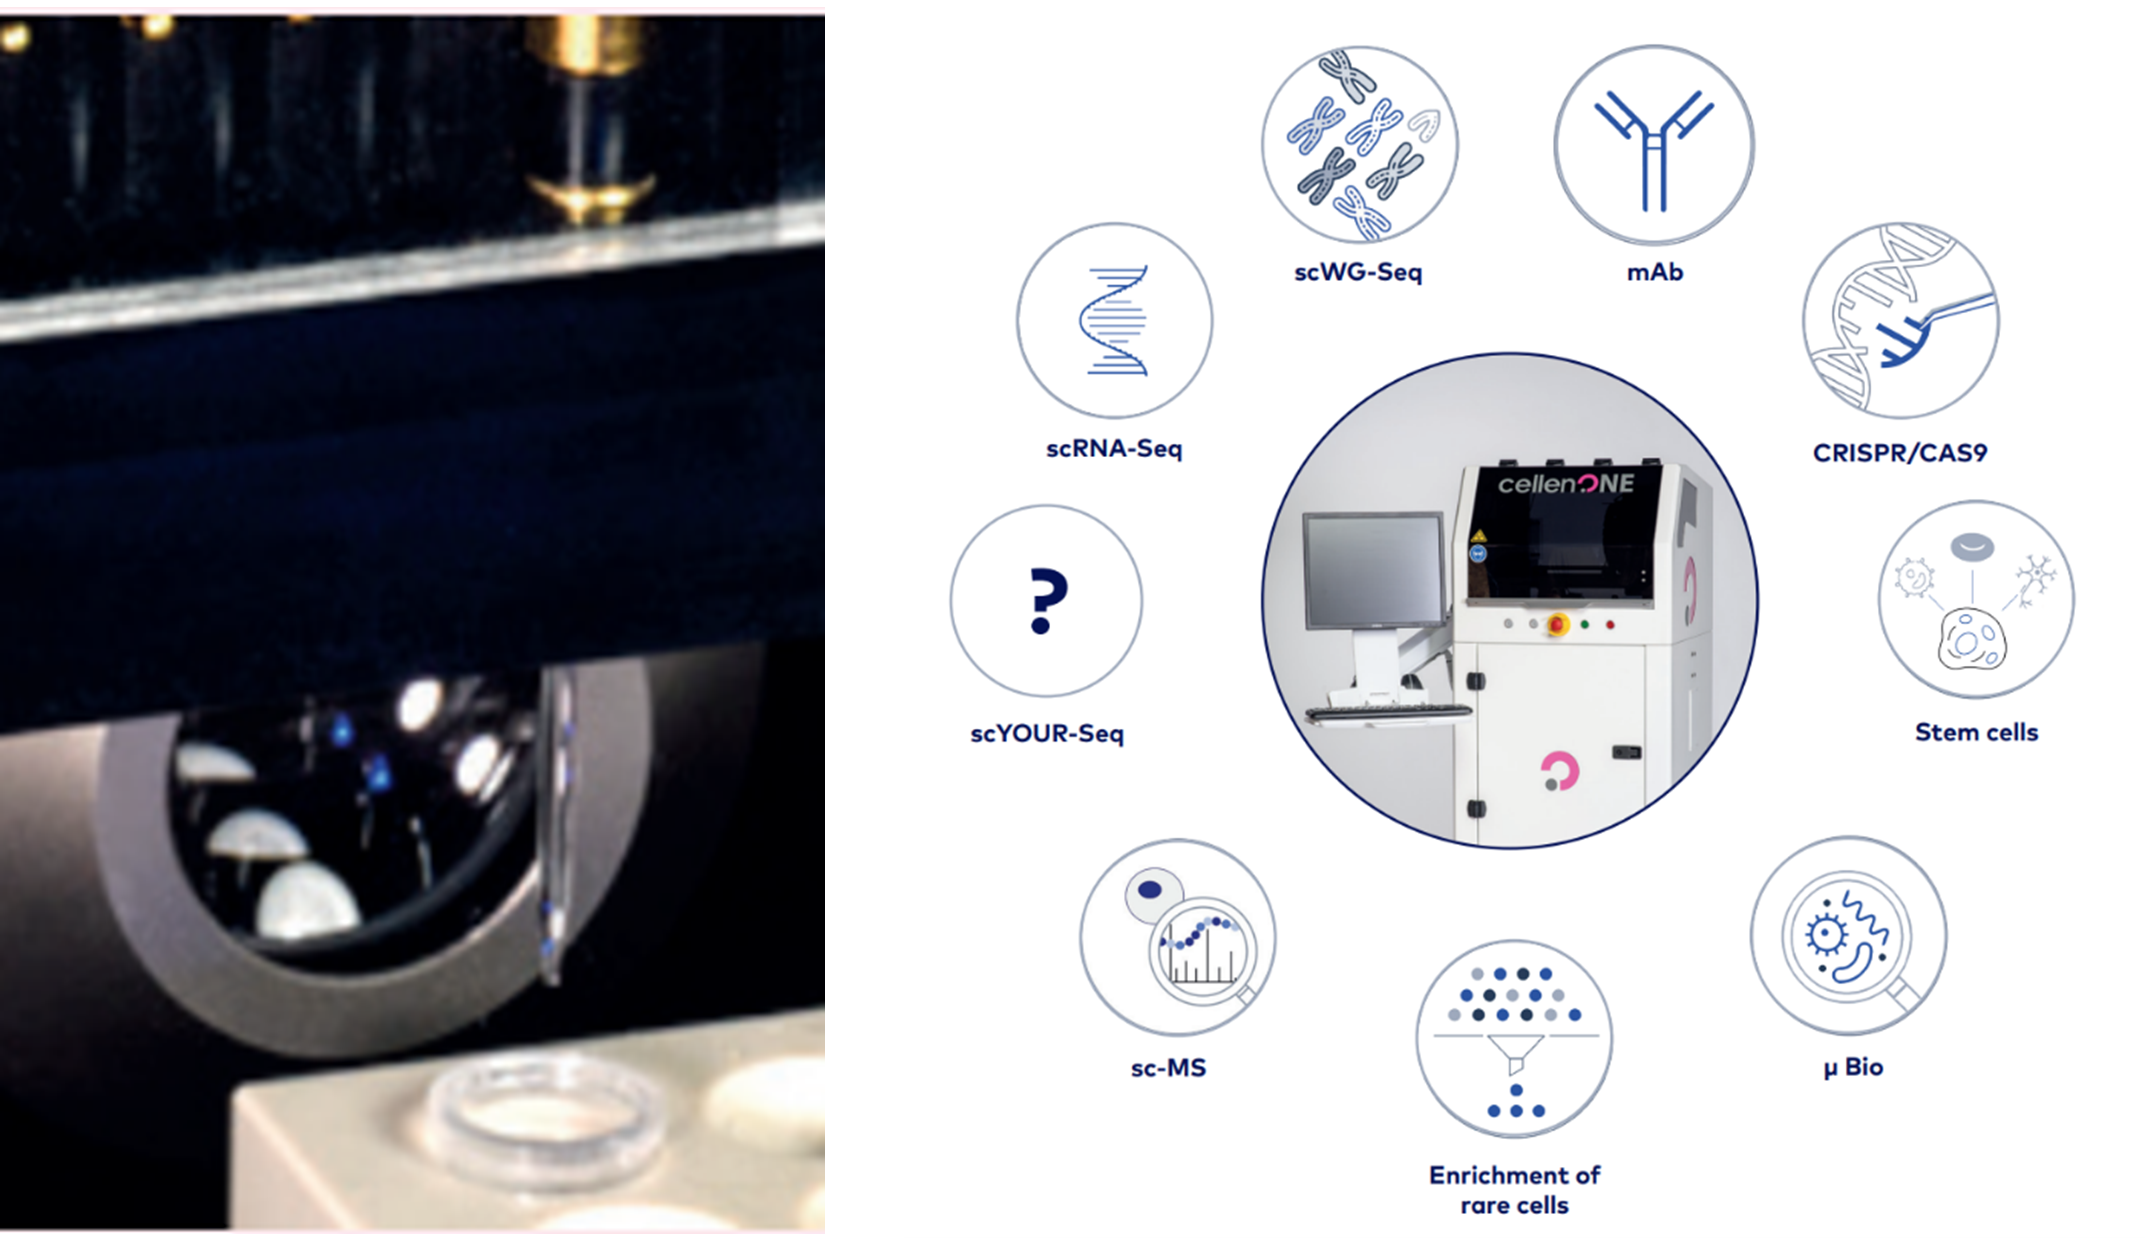 CellenONE (Bico) nanolitre single cell dispensing has many applications across single cell multi-omics (Source: Cellenion.com)
Tecan (TECN, Mkt Cap $6.5bn)CellenONE (Bico) nanolitre single cell dispensing has many applications across single cell multi-omics (Source: Cellenion.com)
Tecan, and other specialized manufacturers of high-end laboratory automation and robotic liquid handling instruments like Hamilton and PerkinElmer give a picks-and-shovels exposure to the mass spectrometry sample preparation workflow.
Examples of Tecan’s portfolio for proteomics mass spec include the Resolvex 2000 instrument: an automated robotics instrument for high throughput peptide sample clean-up in solid-phase extraction.
Solid-phase extraction (SPE) is the phase in the sample preparation of peptide samples that is used to remove the salts (such as urea) and other impurities from the samples after peptide digestion.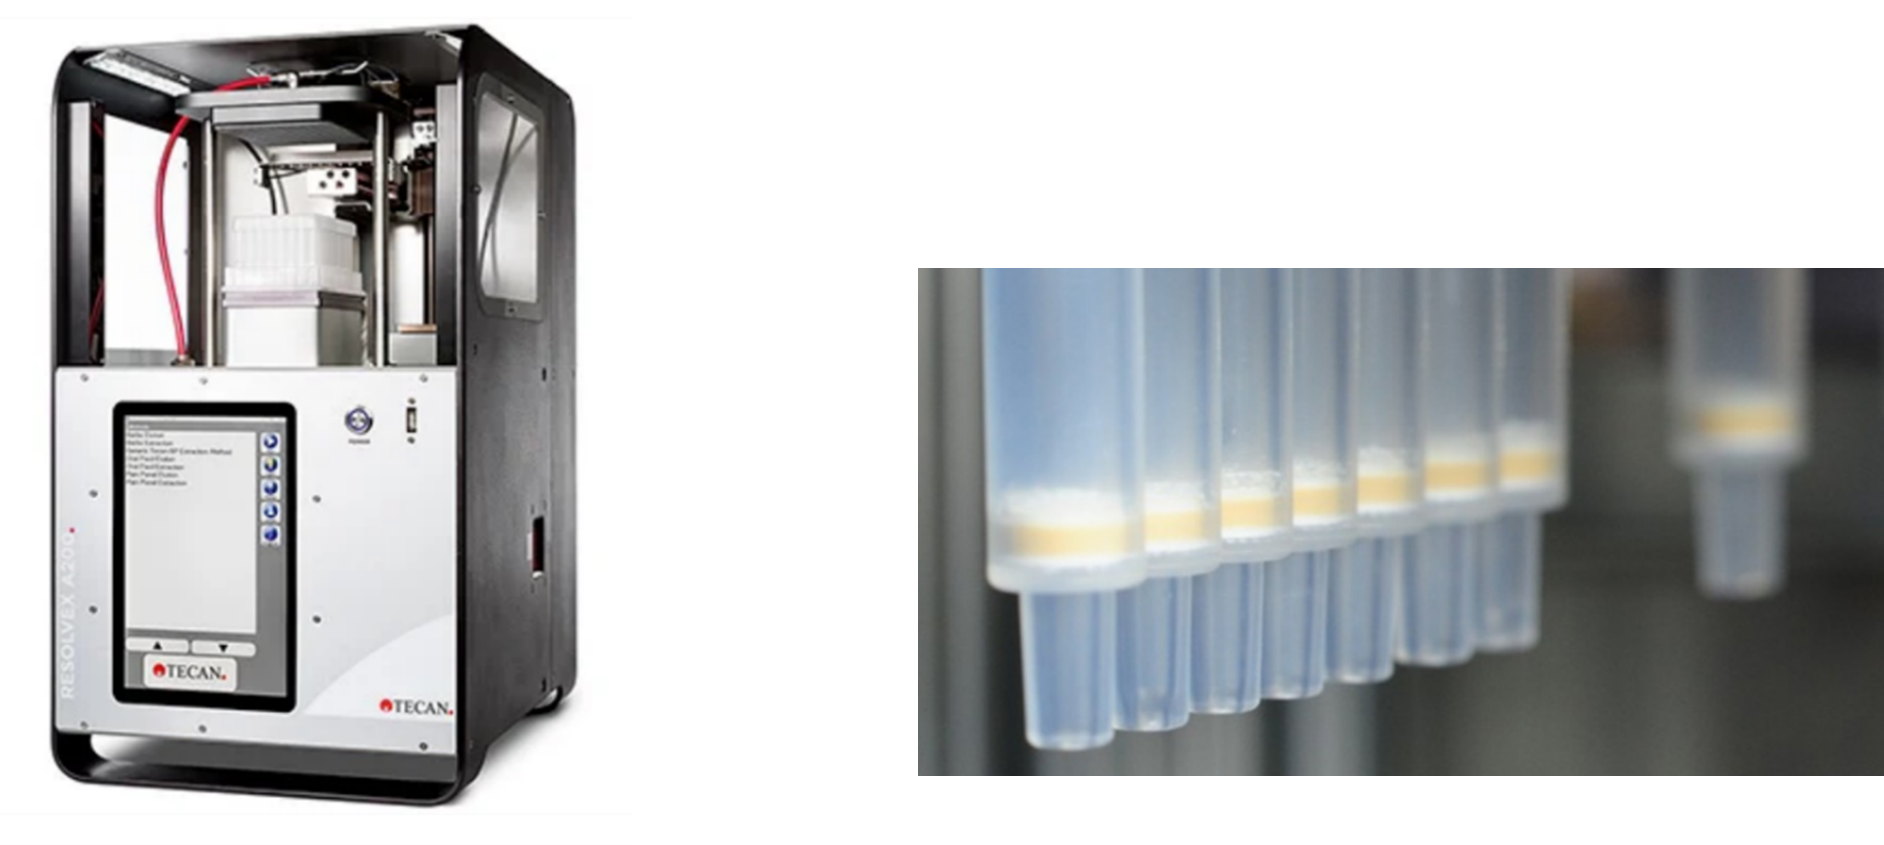 Tecan Resolvex A200 and Cerex Columns
Tecan also has a range of consumables like their Cerex columns and Narrow Bore Extraction Columns, and Protein affinity capture tips, all of which are specialized for handling peptides and antibodies in Mass Spec workflows.
Compared to the more disruptive and more turnkey mass spec sample prep solutions like Seer, Tecan’s liquid handling and cuvette/pipette components have a lower growth profile, although still provide excellent incremental growth to its core business. Compared to larger peers like PerkinElmer and Hamilton, Tecan’s proteomics portfolio is able to contribute more markedly to group growth, and therefore we believe is the best investment opportunity among its direct peers.
- Research Use Antibodies
Key Names:
Abcam (ABC)
Biotechne (TECHNE)
Thermo Fisher (TMO)
Antibodies are highly specific proteins that are able to detect target proteins by binding to their epitopes. Therefore they have been used for many decades both for research into proteins as well as clinical diagnostics assays (ELISA tests).
RUO (Research Use Only) Antibodies constitute bread-and-butter work for most academic labs and are not considered to be part of the highest-growth part of the proteomics analysis market.
They are instead used predominantly for the first generation of protein research (ELISA detection, western blots, and flow cytometry detection).
However, they provide a low-risk way to gain exposure to the overall proteomics industry, because once the sophisticated methods (Mass Spec etc) advance the field and discover new protein biomarkers, researchers will subsequently need to do validation work on those biomarkers, using antibodies. And in addition, there are novel disruptive proteomics detection methods in development that will also leverage antibody based panels, like those of Somalogic and Olink.
Of the many RUO antibody manufacturers and providers, the three highest quality names are:
- Abcam
- Biotechne
- ThermoFisher’s Invitrogen division
The very highest quality names have good growth, as they feed into trends like the transition from polyclonal to monoclonal antibody production.
- Abcam and Biotechne are both recognized as having the highest quality catalogue of antibodies and continue to gain market share and grow in the low double digits on excellent gross margins.
- Both names have exciting growth optionality:
- Biotechne’s antibodies are supplied to the highest-growth proteomics assays, including Olink and Luminex.
- Abcam’s Lightning-Link technology (from its Expedeon acquisition in 2020) allows customers to label antibodies with oligos and fluorescent proteins, with promising use-cased in high-plex proteomics.
- Abcam’s exclusive rights agreement with BrickBio gives further optionality in proteomics research.
- Abcam has entered into an agreement with Nautilus to supply anitbodies, with Nautilus being one of the most promising emerging names in proteomics.
- Disruptive Novel Methods: High-Plex Proteomics & Emerging Moonshots
Key Names:
Olink (OLK)
Somalogic (SLGC)
Nautilus (NAUT)
Quantum Si (QSI)
 Source: Olink, Somalogic, Montanaro Research
There are two particularly interesting names disrupting the market by engineering new ways to increase the throughput, accuracy, specificity and sensitivity of traditional antibody-based assays which are limited in scale. These are Olink and Somalogic.
1/ Olink: The Disruptor leveraging Genomics Infrastructure to Drive Clinical Proteomics
Olink (Nasdaq: OLK)
HQ: Uppsala, Sweden
Market Cap: $2.4bn
Olink has pioneered a way of attaching DNA barcodes onto proteins, allowing protein sequencing to take place via gene sequencing infrastructure.
How does Olink work?
Olink’s product is a proprietary patented assay technology called PEA (Proximity Extension Assay).
Olink’s PEA assay works either on qPCR instruments or Illumina’s Next Gen Sequencing instruments. The assays are based on traditional ‘antibody capture’ methodology, identifying protein targets through antibodies.
The clever bit: not only does using two antibodies per protein target increase the accuracy and specificity, but Olink attaches to each of its two antibodies synthetic DNA molecules called oligonucleotides.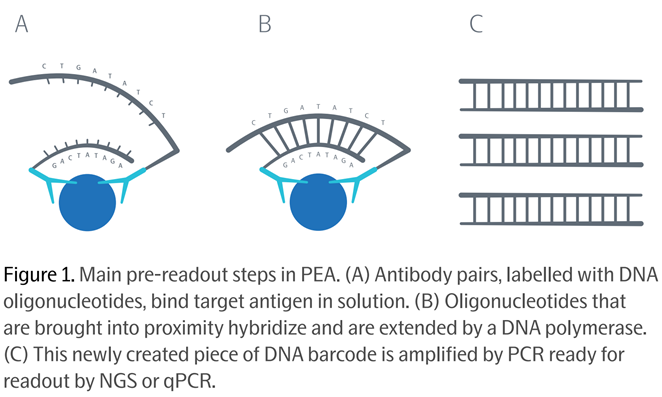 Source: Olink PEA Whitepaper, 2021
After the two antibodies bind to the target protein, their oligonucleotides (each like a single strand of DNA) are brought close together and hybridize into one double-stranded DNA double helix, which is then ready to be amplified by PCR and read at the equivalent throughput of high-end genomics assays.
Strengths
- Olink’s platform has been used to generate close to 300 million protein biomarker target data points from approximately 2.4 million samples.
- Olink leverages the existing infrastructure and installed base of Illumina’s NGS instrument fleet: nearly 20k instruments.
- Has been engineered from the ground-up to be optimized for clinical diagnostic assays. Olink is hopeful that the first clinical diagnostic panel based on an Olink protein signature will be commercialized soon for Multiple Sclerosis.
Weaknesses
- According to our conversations with Bruker, the Olink technology is incapable of going beyond the protein level into the peptide level without getting prohibitively expensive.
- Because the antibodies bind to the epitope of a protein, Olink assays cannot detect different protein isoforms, which have the same epitope.
2/ Somalogic: Using Aptamers to Capture 10,000 Proteins per Assay
Somalogic (Nasdaq: SLGC)
HQ: Colorado, US
Market cap: $2bn
Similar to Olink, Somalogic also has created a high-plex assay that detects proteins via a form of DNA oligonucleotide attachment.
The Somalogic platform, SomaScan, is based on proprietary synthetic reagents called aptamers. Aptamers are similar in function to antibodies, and can bind to protein targets, but are synthetic which gives them an advantage in breadth and speed of discovery. Whereas antibodies can take months to a year to develop, aptamers can take weeks. Somalogic has a library of 7,000 unique aptamers that can identify 7,000 different proteins in a single run from a single sample, in around 48hrs.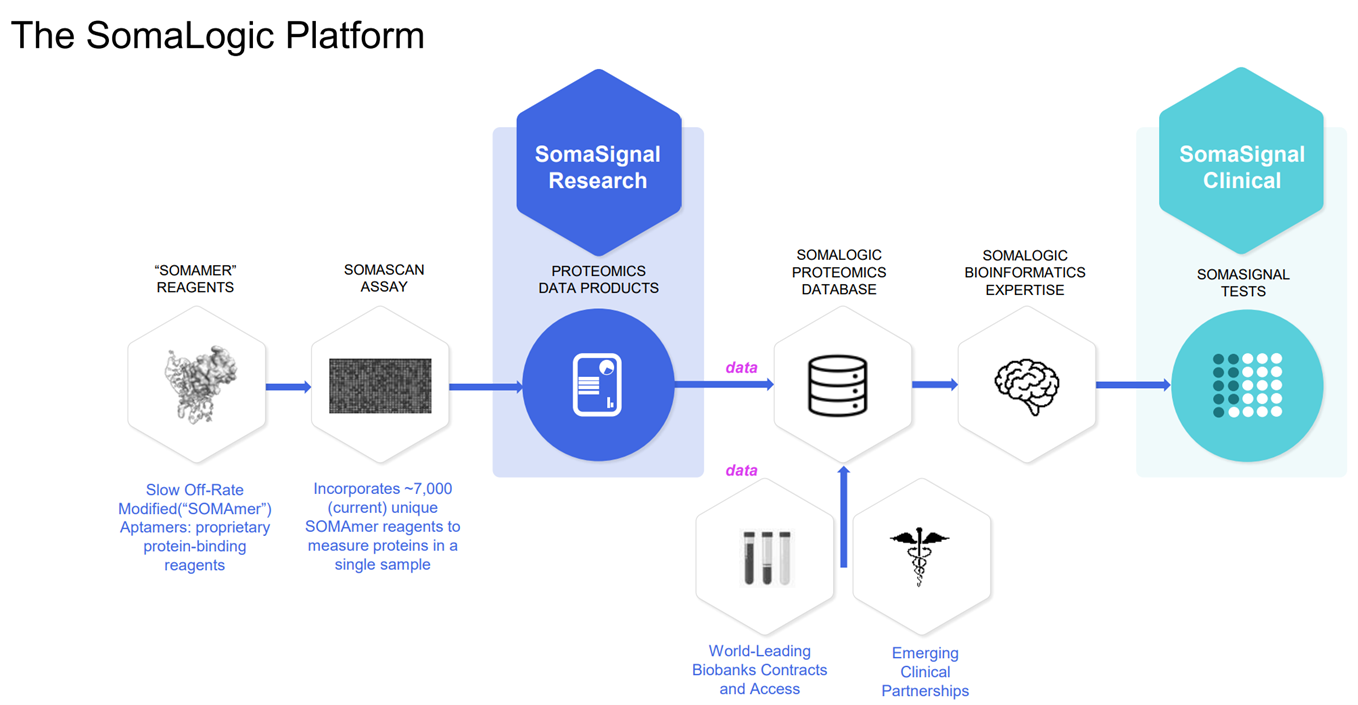 Source: Somalogic Investor Relations
Strengths
- Somalogic wants to get to 10,000 proteins next year which would make it the most broad protein identification method in the world.
- Somalogic’s range of protein identification and throughput makes it particularly suitable for population proteomics. In December 2021, scientists at Amgen used SomaScan to measure samples from 36,000 Icelanders and mapped them to 27 million genetic sequence variants, creating the largest proteomic study to data with 170 million separate protein measurements.
- This also gives Somalogic an opportunity to use machine learning on high level protein signals: i.e rather than specific tests on specific single biomarkers, Somalogic’s tests analyse the signal from thousands of proteins and correlate it to health predictors.
- Somalogic already has 12 SomaSignal tests for is as Lab Developed Tests (LDTs) in CLIA diagnostics labs. There is a pipeline of >100 tests in development.
Weaknesses
- Compared to 4D Mass Spectrometry like that of Bruker, it is also likely that Somalogic’s aptamers would not be able to detect isoforms, given that they also bind to the epitope of a protein.
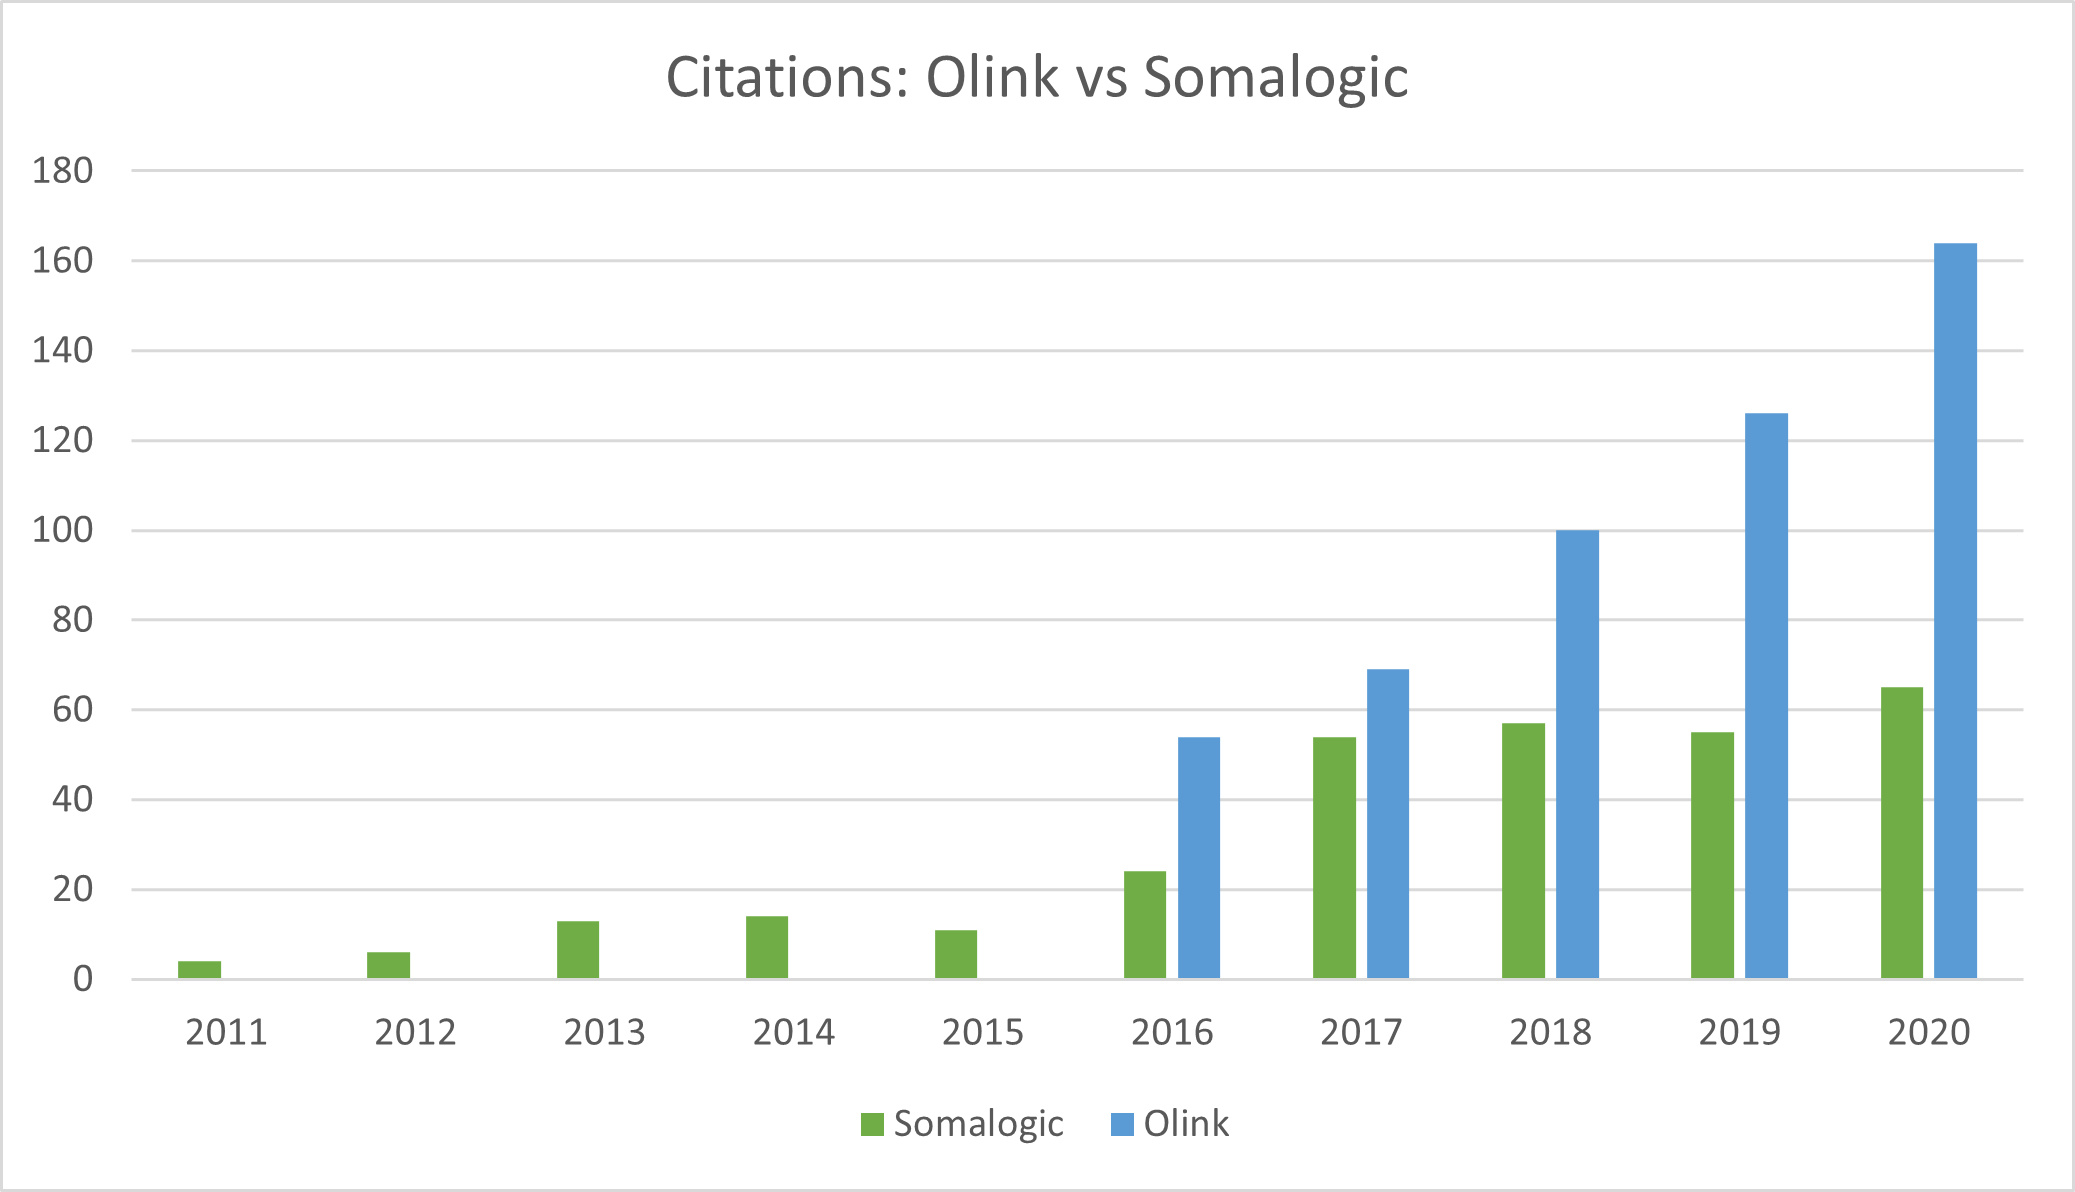
- Somalogic lags Olink in citations and adoption because it would demand to keep the IP of any proteins discovered by the academic community using its aptamers. This strategy is likely changing and will become more open-source to drive adoption.
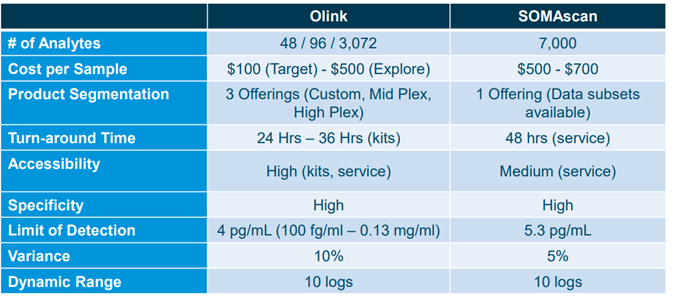 Comparison between Olink and Somalogic by Puneet Souda (Source: SVB Leerink)
Emerging Moonshots: Nautilus and Quantum-Si
Nautilus (Nasdaq: NAUT)
HQ: Seattle
Market Cap: $700m
Of all the novel methods of identifying protein molecules outside of mass spectrometry, Nautilus’ technology seems both the most fundamentally novel, and perhaps the most ambitious, with the aim of quantifying 95% of the proteome from any sample, using both a proprietary instrument, flow cell, and reagents.
Nautilus is very early stage (pre-revenue), and hasn’t proven its technology at scale or commercially. It has built a prototype single molecule instrument using microfluidics and optics for single molecule arrays.
How does it work?
Nautilus has designed a ‘hyper-dense single molecule protein nanoarray’ which contains 10 billion landing pads in a flow cell.
The flow cell itself is architected in such a way to allow reagents to flow across the surface whilst anchoring single protein molecules at a time to each landing pad.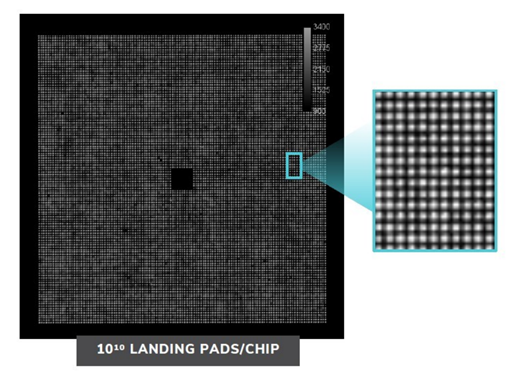 A Nautilus flow cell
Nautilus are working with Abcam to design highly specific antibodies for their reagents. Nautilus believe that their antibodies will be able to target specific enough sites within the protein to distinguish different post-translational modifications.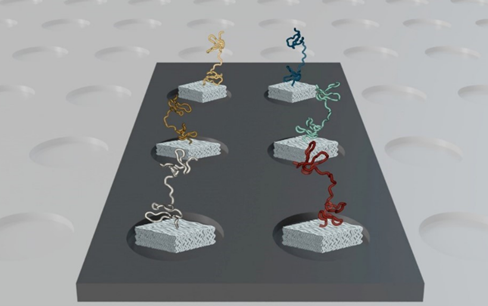 The cell has 10 billion landing pads, enabling single molecule resolution
 Source: Nautilus Investor Presentation, 2021
Strengths
- End-to-end proprietary system, from instrument to flow cells to reagents.
- Engineering of flow cell allows for multiple cycles without damaging protein, allowing for terabytes of data per sample.
- Unit economics would be excellent, in theory, given low cost of reagents.
- Sample prep is particularly simple: the flow cell reduces complexity. This would allow for huge throughput in theory.
- Because the proteins do not get damaged and stay in their landing pads, the Nautilus platform can run many cycles of analysis on each sample, ironing out signal-to-noise problems.
Weaknesses
- Total moonshot: Nautilus is very much unproven today.
- Unclear whether or not the antibodies or aptamers used in the reagents can target PTMs and isoforms.
Quantum-Si (Nasdaq: QSI)
HQ: Connecticut, US
Market Cap: $1bn
QSI is referred to by many as the only provider of semi-conductor based protein sequencing. This is also very much in the moonshot segment, with no meaningful revenues yet.
How does it work?
QSI has designed a single molecule detection chip that generates protein sequencing at the amino acid level. There are millions of wells on each chip.
Proteins are digested into peptides, then go onto the chip. The peptides are attached to a well, and reagents called recognizers label the peptides with fluorescent tags. Each well has a reaction chamber that generates a fluorescent signal.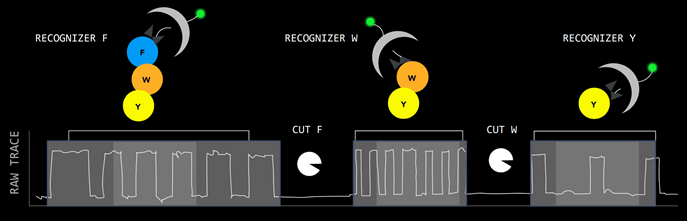 Source: Quantum-Si Investor Presentation, 2021
The half-life of the photon signal is used to derive the amino acid sequence, giving the sequencing greater depth than gene-sequencing which relies on only 4 different fluorescent colours. QSI call this ‘time domain sequencing’.
Differentiating between different photonic signals massively in parallel relies heavily on computational power, so QSI is fundamentally a semiconductor based approach.
Strengths
- End-to-end system, with one sample prep instrument and one analysis instrument, and consumables supplied for both.
- Relies on computing power, so technology scales with semiconductor power.
- “Time domain sequencing” is unique and patented, with promising potential for extremely high throughput at peptide resolution
Weaknesses
- Unproven, awaiting release of commercial instruments in 2022 and academic citations.
- Lack of highly differentiated IP on chemistry/reagent side: the IP is in the software and chip design.
- Unclear if accuracy level will compare to SBS sequencing, given how difficult sequencing accuracy proved to be with DNA, which has only 4 bases.
- Spatial Proteomics
Key Names:
Bruker (BRKR)
10x Genomics (TXG)
Akoya (AKYA)
Nanostring (NSTG)
Tools and methods in spatial biology are entering proteomics research to help researchers gain spatial context to their protein discoveries.
What is Spatial Biology?
Spatial Biology is all about the insights gained from being able to see real spatial images of cells and macromolecules using microscopy imaging.
Spatial biology has historically evolved techniques like Immunohistochemistry and more recently flow cytometry to delve deeper into the cells, which involves staining proteins in cells with antibodies which result in higher resolution optical images.
With both hardware and chemistry advances going beyond flow cytometry, spatial methods now have the opportunity to show scientists high resolution images of cells down to the single cell level, and even the peptide level in some cases.
Use-cases of Spatial Biology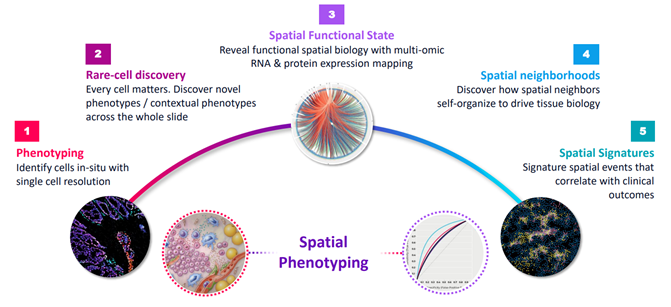 Source: Akoya Presentation, December 2021
Opportunity:
Companies innovating new methods in spatial proteomics have the opportunity to ride the wave of proteomics research and establish themselves in the biomarker validation workflow that follows from the initial protein biomarker discovery.
E.g. A mass spec analysis reveals protein biomarker candidates for a specific cancer. Spatial Proteomics tools can then be used to process and image high volumes of protein image data from tissue samples, giving researchers further insights into the protein biomarkers, and quantitative and optical validation.
Examples of images from Single Cell Spatial Proteomics:
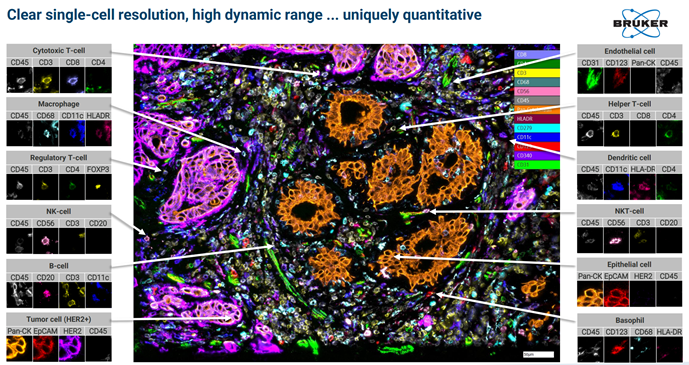 Image taken from a Bruker Canopy Bioscience Instrument
Bruker’s extremely high fluorescent microscopy resolution coupled with high throughput tissue sample processing allows for new applications in proteomics.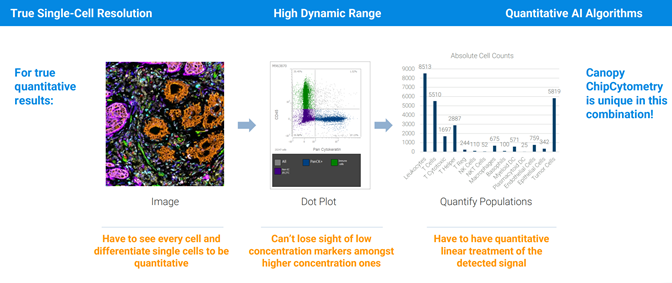 Spatial proteomics data to compliment protein sequencing data from Mass Spectrometry or Multiplex methods.
Key Players in Spatial Biology for Proteomics
- Bruker (BRKR)
- 10x Genomics (TXG)
- Akoya Biosciences (AKYA)
- Nanostring Technologies (NSTG)
Bruker’s strength is in its hardware IP pool: in particular fluorescence microscopy through its NANO division, which allows it to look at cells at the single-photon resolution. By contrast, the other players approach spatial proteomics through a biochemistry patent-pool, with both Akoya and Nanostring leveraging oligonucleotide tagging. 10x Genomics, on the other hand, is entering this space from a leadership position in single cell genomics, and is entering the spatial-omics market with the release of a new solution called Visium. Utility is likely to be lower than peers on the peptide/protein level, but promises to be very high on the transcriptome level, and so will likely have high utility for proteomics PTM research.
- Investable opportunities? The Spatial Proteomics names are interesting, but have narrower and more limited TAMs than the direct proteomics detection players. As part of a portfolio, however, in the case of Bruker and 10x Genomics, these applications are excellent incremental growth drivers.
Framework for Assessing Commercial Success
While understanding the technologies driving innovation in proteomics is important, a separate framework is needed from which to judge the probability that a technology can achieve scalable commercial success.
For new entrants in any space, the two most important considerations are speed-to-market, and barriers to entry after the market is captured. Assuming barriers to entry once market share is established are watertight based on IP, the important question becomes: which technology will get adopted the quickest, and by the highest number of practitioners?
The following factors make up a 5-point Checklist which we use to assess this question: 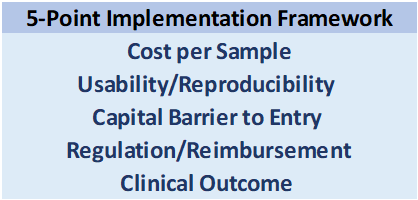 Some considerations:
Cost per Sample
Cost is the principal barrier to adoption for any emerging technology. The explosion in gene-sequencing has roughly tracked its cost curve.
Professor Nikolai Slavov from Northeastern University compared the cost per sample for a next-gen RNA sequencing run using Illumina to a Thermo Fisher Mass Spec run for proteomics analysis, and found that for equivalent levels of quantitative output (benchmarked against identifying 10k proteins), the cost is comparable: ~$300/sample for genomics vs ~$400/sample for mass spectrometry.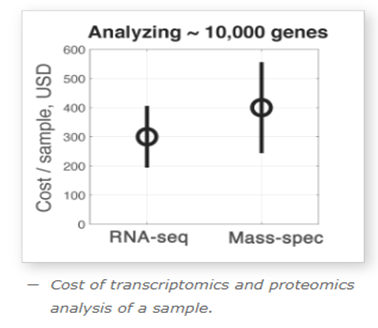 Source: SlavovLab.net
Given the complexity of many mass spectrometry workflows, it is reasonable to think that with scale and standardisation of protocols, costs/sample can converge towards those of genomics.
Usability/Reproducibility
For a technology to scale, it needs a labour force to support it, and this is where ease of use and reproducibility are most important. The principal barrier to entry for mass spectrometry compared to next-gen sequencing is that mass spec engineers are more scarce and highly skilled. Improved software protocols and streamlined sample prep should be able to reduce the complexity of a mass spec workflow to the point of being performed by a standard lab technician, which is crucial for the technology to industrialize.
Capital Barrier to Entry
While ongoing costs per sample tend to vary in the hundreds of dollars, the capital equipment can often extend to 7 figures. Coupled with practical bottlenecks like shortage of space in hospitals, there is a capital barrier in space and cost to overcome in order for mass spectrometry to penetrate clinical settings.
However, the multi-plex methods of Olink and Somalogic do not have this barrier as they take place on either much cheaper capital equipment, or on Illumina machines which are already well penetrated.
Regulation & Clinical Outcomes
The regulatory environment, and reimbursement models that stem from it, can also either inhibit or facilitate the emergence of new clinical methods. The move to outcome-based reimbursement models, especially in the US, could accelerate the commercial adoption of proteomic-based assays in diagnostics.
However, reimbursement models will need to adapt to support personalized clinical outcomes that do not exist today:
In traditional diagnostics, the metrics that matter the most are accuracy and specificity of assay in detection of disease.
However, mass spec-based diagnostics have the potential to open up entirely new parameters. For example, rather than detecting the presence of diseases or a particular analyte, mass spec assays could also be used for risk stratification, and measuring patient’s real-time responses to treatments. Regulatory bodies will have to develop new models of reimbursement that can support the move towards personalized clinical diagnostics that proteomics biomarkers open up.
Conclusions
Proteomics will see a huge increase in funding and research activity in the coming years as innovations in hardware, biochemistry, and computing come together to demystify the human proteome, revealing crucial disease-causing mechanisms and disease-targeting biomarkers.
As proteomics technologies and methods become standardised, proteomics will become industrialized, similar to next-generation gene sequencing in the last decade.
Enormous equity value will accrue to the successful companies that will lead the new proteomics revolution, and we expect to see similar winner-takes-most dynamics to the genomics revolution, although we can expect a fragmentation of successful players around specific applications and test types.
Adjacent TAM-expansion opportunities that will follow as proteomics matures from the Research world to the Clinical world will ensure this space is a growth driver for over a decade.
- Mass Spectrometry could be entering a golden age after decades of hardware innovation in mass spec physics are helped by innovation in sample prep methods and software analysis. Bruker has the best growth opportunity in proteomics mass spec.
- Companies innovating around the mass spec ecosystem like Seer also present investment opportunities, but have a more limited TAM than end-to-end or portfolio companies like Bruker, and a higher risk profile on account of their single-product exposure in a field where there’s all to play for.
- Bico does not carry the same risk because it owns a portfolio of such innovative high risk/reward point solutions, among which CellenONE has strong growth potential.
- The high-plex proteomics names are hugely ambitious: Olink and Somalogic have proven their technology works, and merit further research.
- The moonshots, Nautilus and QSI, are too unproven today, but have highly credible management teams and promising IP, and so merit monitoring over the next 24 months.
High Priority New Ideas: Olink, Somalogic, BICO
Beware the Substitution Risk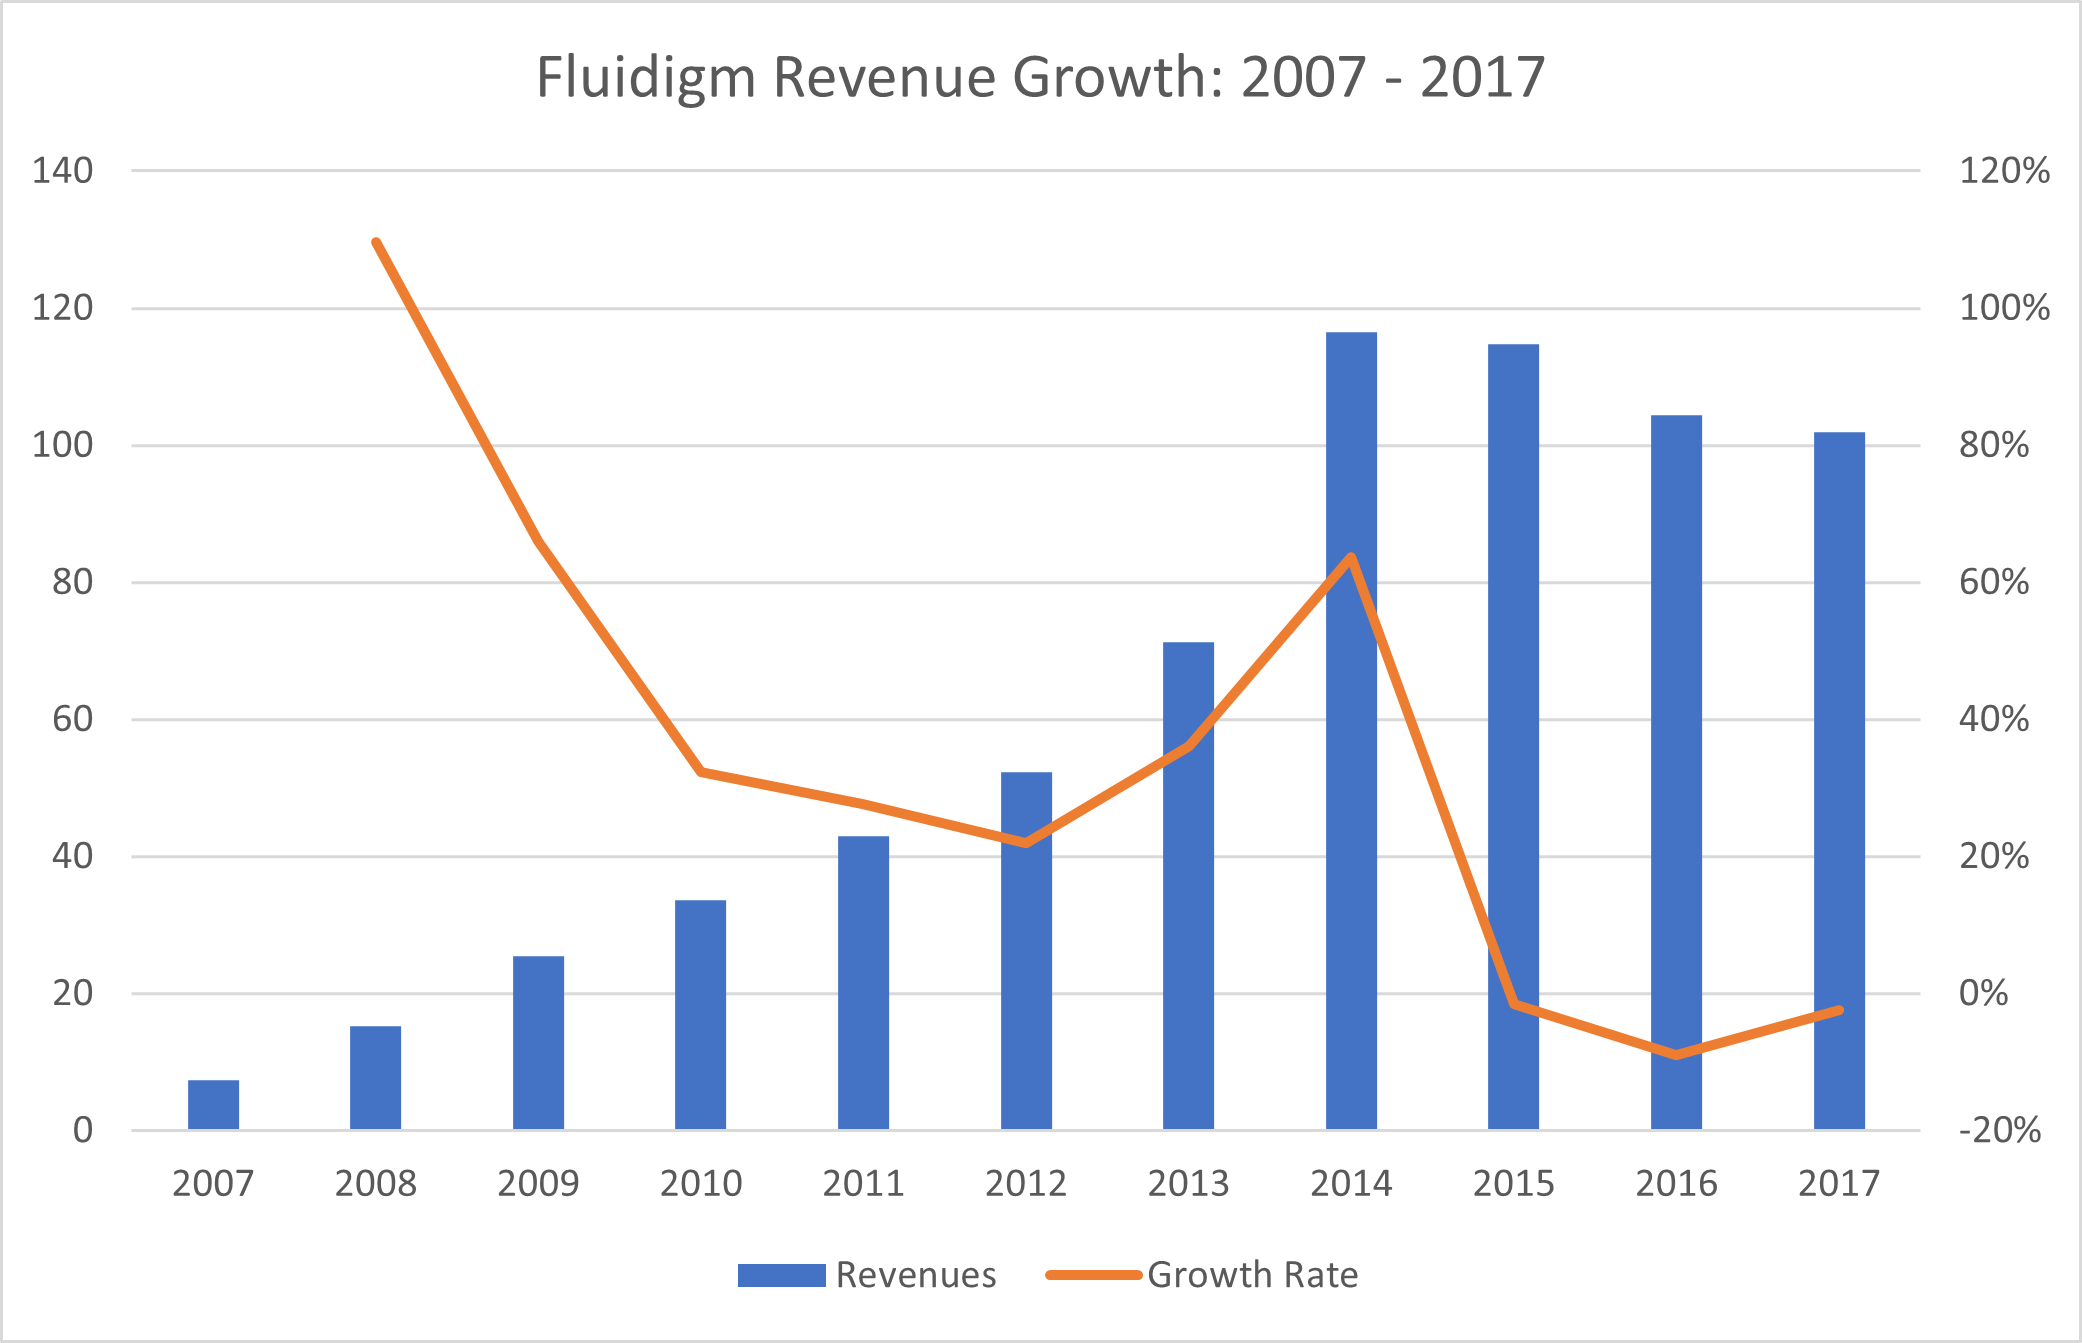 Source: Montanaro Research, Fluidigm
The biggest risk to the investor at this early stage of the proteomics revolution is the substitution risk between the various methods.
It is unclear, for example, if in 5 years the predominant method of detecting peptides will be Mass Spectrometry, or a totally novel method like those of Olink and Nautilus, or a combination of the two.
As an example of substitution risk in the Life Sciences, we see Fluidigm enjoying enormous success with its pioneering microplate qPCR technology for genomic analysis after 2007. However, in the last 5 years, as next-generation sequencing methods led by Illumina have taken over genomics, Fluidigm has stagnated, and much of Fluidigm’s equity value has been destroyed.
The same risk exists in Proteomics, so the Quality Growth investor must be constantly assessing the early stage technology landscape, listening to KOLs, and mitigating risk by investing in portfolio companies with no single-product risk, or companies whose IP has exceptional optionality and TAM potential.