

Inflation and Rates: One Big Lagathon!
That’s it. No more articles on inflation. So boring. Everyone from Jim Cramer to Wall Street Bets punters to 19-year-old Goldman Sachs interns seems to have arrogated on themselves prophetic macroeconomic superpowers, each chiming into the cacophonic LinkedIn chorus offering their two cents (or 1 British penny after the recent mini-Budget) on the nature of inflation.
And now even Montanaro’s analysts are jumping on the bandwagon! So, rather hypocritically, and certainly without authority, let me also chime in while I still can before we collectively get so fed up with the word ‘inflation’ that we ban it altogether. Or maybe give it an updated feel by dropping the vowels. Anyway, I make the case that you should swap worrying about the CPI with drinking some tea, and why interest rates could (should?) over time fall back to their pre-pandemic, cheap-money levels. Thankfully this is not how we invest so I’m allowed to be wrong…
- The CPI Laaaags!
The common measure of inflation quoted in headlines, CPI, is a (very) lagging indicator, a noisy indicator, and hugely skewed on stale data. Not very helpful for trying to figure out what inflation will look like in 12 months, which is what the stock market tries to discount.
In addition, the Consumer Price Index is only relevant in the interest rate debate insofar as it is supposed to be an indicator of how overheated the economy is, which is what toggling the interest rate affects. But what does the US’s September 8% CPI print tell us about how overheated the economy is now (statistics used will be mainly referencing the US economy, with the ideas behind the arguments being largely common to Europe, too, although in any case global financial markets are most influenced by the US economy)? What does it tell us about how it’s reacting to the interest rate hikes year to date?
Not that much at all.
One of the biggest, least talked about problems with CPI is that housing costs (“shelter”) account for 32% of the CPI. The two biggest components of “shelter” are rent prices, and “owners’ equivalent rent”, which is not a real number, but a fictional number approximating what homeowners would be paying as if they were renters: a number imputed based on – you guessed it – market rents.
And if you look at median inflation, which is what policy makers look at to strip out the volatile food and energy prices from the CPI, shelter becomes an even weightier component, constituting 40% of this metric!
Paul Krugman points out the similarity in a recent blog: median inflation and shelter inflation are incredibly tightly correlated.
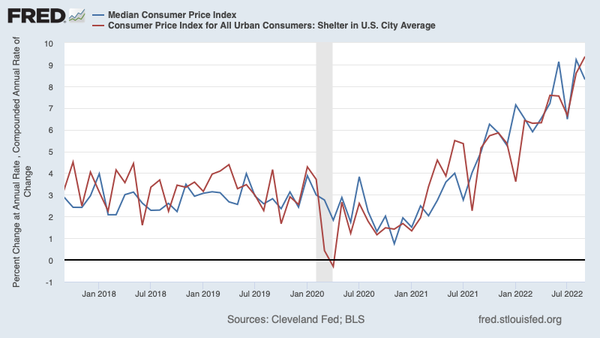
Source: St Louis Federal Reserve
The problem with this, Krugman continues, is that this rent inflation number is unhelpful, twice over.
First, it’s a deeply lagging indicator, because rents are fixed for the term of a lease before being repriced, with a lease typically being around 12-24 months.
So you get an inflation number published in October which is reporting numbers from September, with said numbers possibly reflecting price increases from the September the year before that…this means that there isn’t a single number in that print that is meaningful or helpful in assessing the likely state of inflation tomorrow or even the impact of recent rate hikes taken this Summer, for example.
But it gets worse. Not only is the shelter inflation number structurally stale, but there is also evidence that the “official” numbers are plain wrong. That they are even more lagging and stale than the “actual” numbers, which are nevertheless still lagging and stale. So we’re looking at lagging indicators of lagging indicators, which are about as interesting to the forward-looking investor as a sea urchin at The Races.
A new report from the Bureau of Labour Statistics concluded that its official rent inflation index was probably wrong and wildly lagging the real rental index, which the private real estate marketplace company, Zillow, releases.
If we look at the Zillow index for new-apartment rents with the index used by the Fed for its CPI print, we see a huge difference. We know there was a pop in prices in 2021 driven by the rise in remote working, coupled with the enormous fiscal stimulus from 2020 kicking in fully. The orange line (the “official” numbers) is profoundly lagging the blue line (the Zillow index).
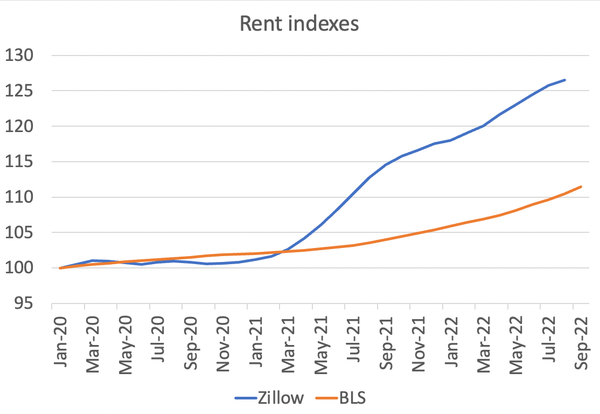
Source: Zillow, Bureau of Labour Statistics
So this means that just as the “official” numbers lagged on the way up; they will lag on the way down. At the margins, in October 2022, are rental prices starting to fall compared to September 2022? It will take many months to show up in the numbers, but certainly the answer does not lie in the most recent CPI print.
There is even another effect at play, which is rising mortgage rates putting people off buying, which is itself deflationary, but encouraging more demand to rotate into the rental market, which disproportionately pushes up the CPI (which does not report changes in actual house prices).
Indeed, the housing market itself has already turned (rent usually lags housing): for the first time in about a decade, house prices in the US went down in September, as printed in the Case-Shiller Index. But these prices do not get captured in the CPI print, which instead treats home-buying transactions as ‘services’ and imputes a lagging rental price on them.
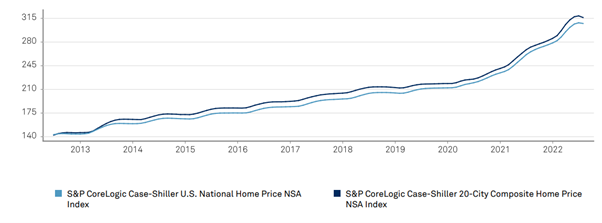
Source: S&P Global
The UIG shows Inflation has turned
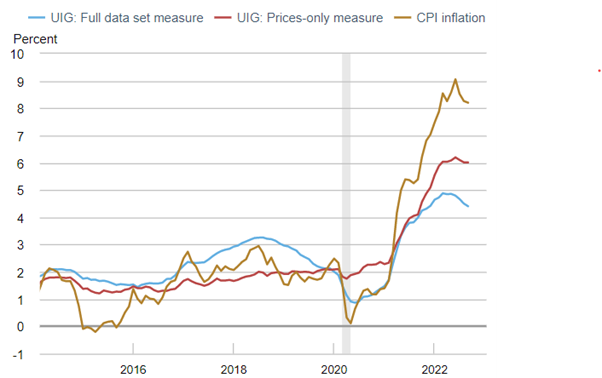
Anyone ever heard of the UIG? The Underlying Inflation Gauge? Neither had I until this week. The UIG is published by the New York Fed and attempts to provide a better, less stale indicator of inflation by also looking at dynamic financial and macroeconomic variables that are leading price-setting indicators.
It does not fix the problems of the CPI because it also incorporates the CPI data, but augments it with “better” data, thereby at least diluting the problem.
The UIG (blue line) shows underlying inflation running at 4.4% in September, down from its 4.9% peak in May. Interesting. It shoes the economy running hot, but no doomsday levels of inflation, and a clear direction of travel quite steeply downwards.
And what about Expectations?
Inflation Expectations are important. Proponents of the “inflation-is-here-to-stay” camp used to suggest that inflation expectations would become unanchored, leading to the kind of self-fulfilling inflationary forces we saw in the 1970s.
But this argument has gone quiet, because it hasn’t happened, according to all data that surveys inflation expectations.
Among many reasons, one reason could be that inflation has been felt as transitory in the real economy, insofar as the average shopper has already noticed a plateauing of prices. As a quick anecdote, my local pub has raised its prices from about £5/pint to nearly £7. Will they be £7 in 6 months? I don’t know, but I feel pretty confident they won’t be £9.
In addition, inflation needs to be sustained for quite a long time in an upward trajectory before becoming embedded in consumer psychology. But as we see with the UIG, the economy has gone from inflation trough to peak in something like 12 months. Nowhere near enough to really move long term inflation expectations.
Therefore, the feedback loop which in the textbooks posits that I as a consumer will rush to the pub now to guzzle as many pints as possible, in fear of prices continuing to rise at the same rate, thereby unwittingly causing prices to rise further, simply does not hold. I can quite assure you that I’m drinking fewer pints at these prices, not more.
And that’s without getting into structural and institutional differences between now and the 1970s that make it more difficult for expectations to become unanchored (not least, that Central Banks now have inflation-targeting as their primary mandates, and are quite conspicuous in their communications to the media and the public around stamping out inflation).
Wages?
And finally, let’s touch on wages. I also think these are a lagging indicator (wages have a level of stickiness), but nonetheless many see them as important indicators for the direction of travel.
It turns out wage inflation peaked around the Spring at around 5.6%.
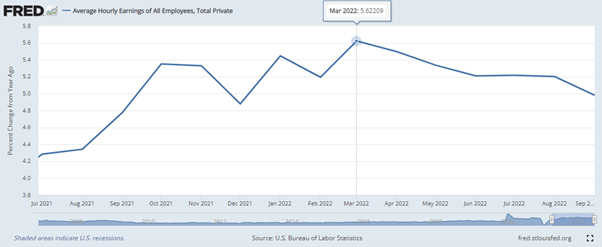
Source: St Louis Federal Reserve
- The “Natural Rate of Interest”
What does this all mean for interest rates? After all, inflation itself is good for the relative performance of Quality Growth stocks, but harms their equity valuations indirectly via adjustments to the cost of capital/interest rate expectations.
“QE is finished”. “Low interest rates are finished”. “A new era of high interest rates”. I’ve heard phrases of this ilk banded around recently.
Bold call, if you agree. I would describe it as a rather eccentric prediction to suppose that we are exiting a 30-year downward trend in interest rates and cost of capital, which is underwritten by very concrete macroeconomic forces. So is there any reason to believe that interest rates will for some reason settle at a structurally higher place than their pre-pandemic levels?
Of course, one reason might be that inflation will persist at elevated levels well into the future, but I hope the previous discussion dispels this.
Are there any other reasons? Hard to tell; some of those who espouse this structurally-higher interest rate vision have a habit of avoiding analysis of first principles (“Interest rates were higher in the 20th Century!” is not first principles analysis). At risk of over-paraphrasing, I have had a few exchanges recently that resembled something along these lines:
“QE was a silly experiment gone totally wrong!”
- Okay sure, but why?
“Because it led to inflation 10 years later!”
- 10 years later?? So you have 10 years of QE with no inflation, and then a pandemic after the 10 years, but it’s the previous decade’s QE that caused today’s inflation?
“Yeah!”
- Wasn’t that caused by Covid supply shocks? And the biggest fiscal stimulus in history (per capita)? And an overshooting in lowering interest rates even further beyond their naturally low level? All at once?
“No! All QE will go away! Forever!”
*
As has been well documented, if the QE of the 2010-2019 period was keeping yields artificially low, there would have been an imbalance between savings and investment that would have caused inflation. But it did not cause inflation in that period. So there is no reason to believe that the cost of capital was artificially low in, for example, 2018 or 2019.
This is of course uncontroversial because the alternative would be to call all Central Bankers stupid and fundamentally mistaken for a decade consistently, which I think is unlikely.
Let’s go one step further.
What does an interest rate actually do? What is it there for? It’s there to balance savings and investments. If interest rates are too high, there is an imbalance that means savings > investments, causing deflation; if interest rates are too low, then there is an imbalance skewed in favour of excess investments, which in turn causes inflation.
The magic number for the interest rate that causes these two things to balance is referred to as the “Natural Rate of Interest”.
Very briefly, this “magic number” is dynamic, and a function of the return environment of that economy. So, in a dynamic, high GDP-growth economy, with a growing population, and with productivity growth, the capital returns available to capital allocators would be so high that they would require a much higher natural rate of interest to counterbalance that high inclination to allocate capital like crazy with a proportionate incentive to save. This was the macroeconomic environment of much of the 20th Century, which was a century of dynamic growth.
By contrast, take the last 30 years. Slowing and structurally maturing GDP growth (look at the Solow Curve – this is normal); an ageing population; sluggish or flat productivity growth; technological innovation slowing down with respect to how it impacts productivity (If you disagree, think of this: have there been any inventions in the last decade that rival the invention of the internal combustion engine or commercial air travel or the internet and the mainframe computer, with respect to productivity improvements?).
All this means that the capital returns environment is structurally more depressed than it used to be. Therefore, it takes a structurally lower natural rate of interest to balance savings vs investments.
Indeed, demographics might be the most important factor in the equation. Take Japan; it has the most ageing demographic. It also has the lowest interest rates. This is not a coincidence.
So the question for anyone who believes that the cost of capital will structurally trend up over the next 5 years is: what has changed about any of these macroeconomic fundamentals in the West?
I’m not a macroeconomist or a soothsayer, so not professing to know the answer: but there is quite the burden of proof on anyone espousing that this 30-year, textbook macroeconomic trend will reverse.
- Interest Rates Impact Economies…also with a lag!
The notion of lags is central to this blog post. Lags not only affect the reporting numbers of inflation, but inflation itself.
For example, if we take any possible inflationary input, like corporate tax cuts, one sees how many steps it takes to produce that final CPI number:
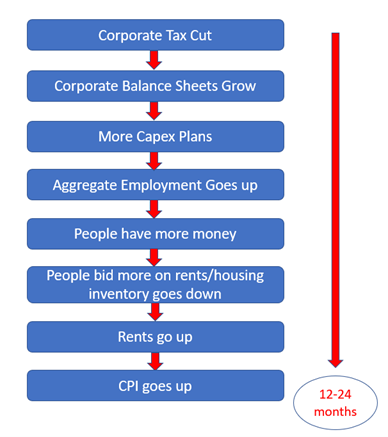
Source: Montanaro
This is just one illustrative example taking one input (tax cuts) and showing one output (shelter within CPI). In reality, the Covid period had so many such inputs: expanded QE, fiscal spending policies, supply shocks, etc.
It’s important to understand that this also applies to interest rate/monetary policy. Were step 1 in the above flow chart to be “lower interest rates”, it would still hold.
In exactly the same way, the Federal Reserve has spent the last 9 months or so raising interest rates (with most rate hikes concentrated in the last three months). The deflationary effects dampening prices today as a result of this year’s rate hikes are the tip of the iceberg. This is simple mechanics, because it would be impossible for a rate hike that took place in, say, August, to make a dent on the economy by September. Rate hikes work in so many ways: by influencing corporate spending decisions, which in turn lead to lower employment and/or wages, and in turn lead to less consumer spending; by dampening consumer spending by increasing mortgage costs, which take time to roll over because most mortgages are not on variable rates; etc.
Simply speaking, things take time. It is very promising that inflation has already started turning, in spite of the lagging mechanics, and therefore it feels likely that, just as the Fed overshot on the way down, it might also be overshooting on the way up with its hikes.
If we look at history, the last time the Federal Reserve embarked on such a similar rate-hiking campaign in order to deliberately and sharply cool the economy was in the early 80s.
The below chart shows that in 12 months of yields rising (blue), from 1980 to 1981, there was no movement in the unemployment rate (red), until the following year.
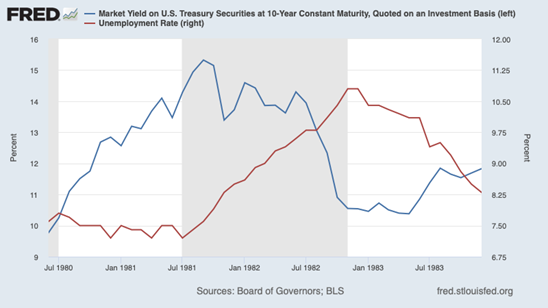
Source: St Louis Federal Reserve
- Is there a conclusion?
For us as equity investors, I recall one of Alex Magni’s (Montanaro Portfolio Manager) favourite phrases: “What’s in the price?”.
Well, after the sharpest period of valuation correction concentrated on growth equities in my lifetime, it is fair to say that a much higher cost of capital (Fed Funds Rate being sustained at around 4-5% in the mid term), as well as a likely 2023 earnings recession, is largely priced into most equities.
Some corners of the market have more bearishness already priced in (e.g those most sensitive to the cost of capital), whereas other corners of the market whose valuations depended less on the 2022 repricing of the cost of capital, and more on the 2023 earnings outlook, clearly may still have some more material embedded risk.
It is an unfortunate fact that Quality Growth has underperformed in such an aggressively quick rate-hiking environment. But it is at least the case that the balance of risk has moved away from cost of capital and towards earnings, and in such an environment we expect Quality Growth stocks to outperform more recession-sensitive, cost-sensitive stocks in the first phase of this recession, and most likely to continue to outperform in the recovery phase where the cost of capital must revert back to its ‘natural rate’, which in today’s world of ageing demographics and maturing growth, is low.